
Research Article
Ann Materials Sci Eng. 2025; 9(1): 1052.
Photocatalytic Performance of CeO2 Nanoparticles Synthesized via Sol-Gel Method under Different Acidic pH Conditions for Methylene Blue Degradation in Wastewater
Razzaq AN1, Ahmad Z2*, Saddique AB3*, Aslam AB4, Imtiaz W5 and Shahid MA6
1School of Physics, University of Agriculture, 38000, Fasisalabad, Pakistan
2School of Physics, University of the Punjab Lahore, 54590, Punjab Pakistan
3Hangzhou Institute for Advanced Study, Hangzhou 310024; University of Chinese Academy of Sciences, China
4School of Physics, Xi’an Jiaotong University, Xi’an, Shaanxi 710049, P.R. China
5Department of Material Science and Engineering, Beijing Institute of Technology, Beijing, China
6Department of Physics, The University of Lahore, Punjab, Pakistan
*Corresponding author: Zeeshan Ahmad, School of Physics, University of the Punjab Lahore, 54590, Punjab Pakistan Email: za6775858@gmail.com
Abu bakar Saddique, Hangzhou Institute for Advanced Study, Hangzhou 310024; University of Chinese Academy of Sciences, China Email: abubakar@zju.edu.cn
Received: April 18, 2025 Accepted: April 30, 2025 Published: May 05, 2025
Abstract
In this study, Nano-crystalline cerium oxide (CeO2) nanoparticles were synthesized using cerium nitrate hexa-hydrate as a precursor through a simple and cost-effective sol-gel method, with the pH of the reaction solution varied between 6 and 12. The synthesized CeO2 nanoparticles were then utilized for the photocatalytic degradation of methyl Blue (MB) in wastewater under direct sunlight. The structural properties, crystallinity, morphology, and photocatalytic performance of the CeO2 nanoparticles were characterized using X-ray diffraction (XRD), Fourier-transform infrared (FTIR) spectroscopy, scanning electron microscopy (SEM), and UV–V is spectroscopy. The results revealed that the pH of the synthesis solution had a significant influence on the photocatalytic degradation of MB. CeO2 nanoparticles synthesized at pH 8 exhibited the highest photocatalytic activity. Additionally, the photocatalytic efficiency was strongly affected by factors such as catalyst loading, initial MB concentration, pH of the wastewater, and exposure time. Under optimized conditions, approximately 75% degradation of MB was achieved after 80 minutes of sunlight exposure. The low-cost CeO2 nanoparticles developed in this study offer a promising solution for the treatment of industrial wastewater containing dyes, utilizing natural sunlight year-round.
Keywords: Photo-catalyst; CeO2; Sol-gel; Water purification; Dye degradation; Methyl Blue
Introduction
Water filtration and distillation play a pivotal role in nations with underdeveloped infrastructure, such as Pakistan, where a significant number of diseases are transmitted through contaminated drinking water supplies [1]. Among the many pollutants, some substances like azo dyes, which do not react with light, acids, bases, or oxygen, can contaminate water even in small concentrations. One such dye, Methyl Blue (MB), is widely used across industries, including printing, textiles, pharmaceuticals, and research laboratories. Unfortunately, this dye poses serious health risks when it enters the human body, potentially causing adverse effects such as heart palpitations, lung tissue degeneration, and vomiting. As a result, MB was chosen as a model compound for studying its photocatalytic degradation process [2]. The degradation of MB involves breaking down its macroscopic structure into smaller molecules, such as carbon dioxide (CO2) and refined derivatives, through various catalytic processes [3]. Notably, photocatalytic technology presents a promising solution for environmental management due to its ability to break down pollutants without generating secondary contamination [4]. Metal oxides, such as chromium (Cr), vanadium (V), zinc (Zn), titanium (Ti), tin (Sn), and cerium (Ce), are known to be effective in photocatalytic processes due to their ability to generate charge carriers under the right conditions, making them valuable in fields ranging from electronics to environmental cleanup [5]. When metal oxides are irradiated with visible or ultraviolet (UV) light, excited electrons move from the valence band to the conduction band, creating electron-hole pairs (e- / h+), a phenomenon known as photo-catalysis [6] These charge carriers are highly reactive and can oxidize and reduce molecules adsorbed on the surface of the metal oxide, facilitating the degradation of pollutants like organic dyes [7]. In the photocatalytic process, electrons combine with oxygen molecules to form superoxide anions, while holes interact with water molecules to generate hydroxyl radicals. These reactive species serve as powerful agents for breaking down organic dye compounds commonly used in industrial applications [8]. The process of heterogeneous photo-catalysis, or semiconductor sensitized photoreactions, further emphasizes the versatility of metal oxides in environmental remediation [9]. In one classification of these systems, the initial photo-excitation occurs in a substrate molecule, which then engages with the catalyst material in its ground state. In another approach, the catalyst itself undergoes photo-excitation and subsequently reacts with a substrate molecule in its ground state [10].
Various metal oxides, including TiO2, ZnO, SnO2, and CeO2, have long been utilized as photo-catalysts due to their abundant natural availability and well-documented efficacy [11,12]. Among these, cerium oxide (CeO2) has attracted significant attention due to its extensive applications in fields such as biomedical research [13] and catalysis. It is used as an electrolyte in solid oxide fuel cells, a material with a high refractive index, and as an insulating coating over silicon surfaces [14,15]. Additionally, CeO2's photocatalytic and sonocatalytic properties have made it a subject of intense study for dye degradation and water purification applications [16,17]. Its unique surface properties, including redox behavior, have been found to enhance catalytic and photocatalytic activities, making CeO2 an ideal candidate for environmental applications [18].
Research has demonstrated the catalytic efficiency of ceria and its nanocomposites in degrading a variety of dyes, including Methylene Blue [19], Methyl Orange [20], Rhodamine [21] and Methyl Red [17]. The nanocomposites of cerium oxide, in particular, have been extensively studied for their enhanced oxidation activity [22]. Beyond dye degradation, cerium oxide nanoparticles (CeO2 NPs) are also being explored for their multifunctional properties in photochemistry and electrochemistry, including applications in solid oxide batteries [23], organic contamination degradation [24], high-performance catalysis [25], sensors [26], abrasive particles [27], coating materials [28] and numerous others.
The synthesis of cerium oxide nanoparticles has been achieved through several methods, including ball milling [29] flame spray pyrolysis [30] reverse-phase evaporation [31] micro-emulsification [32] hydrothermal and solvothermal methods [33,34] sol-gel techniques [35] and even green synthesis methods [36]. The low cost, enhanced photocatalytic activity, photostability, reusability, tunable properties, and the ability to absorb visible light have made CeO2 NPs an attractive option for photocatalytic applications [37,38].
In this study, we report a low-temperature, facile sol-gel method for synthesizing CeO2 nanoparticles by varying the pH of the reactants. The photocatalytic performance of the synthesized nanomaterials was thoroughly examined for their ability to degrade Methyl Blue (MB) dye under sunlight [39]. A range of characterization techniques were employed to investigate the properties of the prepared nanomaterials [13,22,40], and the optimization of reaction parameters was conducted to maximize the dye degradation efficiency. The results of this study are especially significant for countries like Pakistan, where industrial dye-contaminated effluents often mix with drinking water, posing a severe public health risk [39]. By utilizing low-cost CeO2 NPs-based, sun-driven photocatalytic technologies, this research offers a viable solution for tackling water contamination and potentially saving millions of lives annually.
Materials and Methods
Materials
Cerium nitrate hexahydrate [Ce(NO3)326H2O], urea [CO(NH2)2], hydrochloric acid (HCl10 %), ammonium hydroxide (NH3OH), sodium hydroxide (NaOH), methyl Blue (MB) as well as distilled water. No further processing was required because all of the compounds had been in the analytical form.
Preparation of Aqueous CeO2 Nano-Sols and CeO2 Nano- Powder
The sol-gel method, based on previous work published by Periyat and his colleagues, was used to synthesize the ceria nano-sols and nanopowders [41]. At room temperature, four different sols were prepared, each with a different pH during synthesis. To prepare the first sol, 8.64 g of cerium nitrate hexahydrate (Ce(NO2)2·6H2O) was dissolved in 100 mL of distilled water and vigorously agitated for one hour. A 0.1 M NaOH solution was gradually added to the mixture to precipitate cerium hydroxide, adjusting the pH to a range between 6 and 8. From this point onward, this solution will be referred to as Solution 1. To prepare the second sol, urea (CO(NH2)2) was dissolved in 200 mL of deionized water to create a 0.1 M solution. The urea solution was then gradually mixed with a 10% HCl solution until the pH reached 2. This solution will henceforth be referred to as Solution 2. Next, Solution 2 was added dropwise to Solution 1 using a burette, with continuous stirring. Once Solution 2 was fully incorporated into Solution 1, the mixture was stirred for an additional hour to ensure a homogeneous and clear ceria sol. These sols are subsequently designated as C-sols. The C-sols, prepared under varying pH conditions, were then dried in an oven at 70°C. The resulting xerogels were collected in ceramic dishes and calcined at 600°C for 2 hours. The calcined products, which had a whitish appearance, were identified as CeO2 nanoparticles and will be referred to as CeO2 hereafter, as shown in Figure 1.
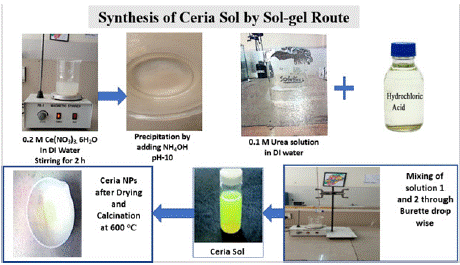
    Figure 1: Schematic representation of synthesized CeO2 NPs. The
synthesis of CeO2 nanoparticles using the sol-gel route begins with stirring
0.2 M Ce(NO2)2·6H2O in deionized (DI) water for 2 hours. Precipitation is
then carried out by adding NH4OH to adjust the pH to 10. Separately, a 0.1 M
urea solution in DI water is prepared and mixed with hydrochloric acid. These
two solutions are combined dropwise to form a ceria sol. The resulting sol is
dried and calcined at 600 °C to produce CeO2 nanoparticles.
Characterization of the Synthesized System
The physical and morphological characteristics of the created CeO2 catalysts were observed using several characterization methods before assessing their photocatalytic performance. The crystallinity and crystallite magnitude of the CeO2 particles were tested using X-ray diffraction (XRD). Scanning electron microscopy (SEM) was employed to measure the particle distribution and surface morphology. Additionally, the optical and structural properties of the catalysts were further investigated using Fourier transform infrared spectroscopy (FTIR).
Photocatalytic Studies of CeO2 Nanoparticles
The photocatalytic activity of the manufactured CeO2 nanoparticles was assessed by evaluating the degradation of a methyl blue (MB) dye solution under direct sunlight. The experiments were conducted on spring days with an ambient temperature of 33.88°C and standard sunlight intensity [42]. Sunlight was chosen as the light source for the photocatalysis tests because it is abundant, sustainable, and contains both UV and visible light, which are known to activate photocatalysts and accelerate chemical reactions. Using sunlight aligns with the development of environmentally friendly and energyefficient methods for applications such as air and water purification [43].
Methyl orange, an azo dye commonly used in the printing, leather, textile, pharmaceutical, and research industries, was selected as the target dye for degradation. This dye is highly toxic and resistant to degradation, posing a significant risk to human health. It can be absorbed through the skin, leading to symptoms such as vomiting, rapid heart rate, and damage to lung tissue [2]. Photocatalytic degradation tests were conducted in 50 mL conical flasks containing 2 mg of CeO2 photocatalyst in 10 mL of a 20 ppm aqueous solution of MB dye. The flasks were exposed to sunlight for predetermined periods.
The absorbance of the remaining dye solution was measured using a UV-Vis spectrophotometer in the 400–700 nm wavelength range. The maximum absorbance (λ_max = 484 nm) was determined, and the photodegradation of MB was measured at different time intervals. The percentage degradation of MB was calculated using the following equation [44]:
![]()
Anywhere A0 is the maximum preoccupation at zero time and At is the maximum obsession at maximum time or when the degradation process is complete.
Results and Discussion
X-ray Diffraction (XRD) Analysis of CeO2 Nanoparticles
The X-ray diffraction (XRD) patterns of CeO2 nanoparticles synthesized under two distinct conditions—pure CeO2 and CeO2 synthesized at pH 5—are presented in Figure 2. The diffraction peaks observed were sharp, intense, and well-resolved, indicating the high crystallinity of the synthesized nanoparticles. This suggests that both samples possess a highly ordered crystal structure with minimal amorphous content, making them suitable for applications requiring materials with well-defined physical properties.
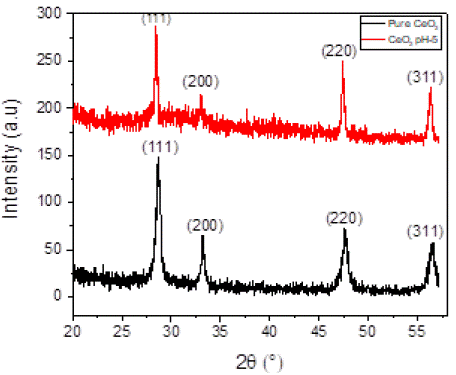
    Figure 2: Time series Dye Degradation Percentage. Table shows the percentage of dye degradation over time for samples at pH-1, pH-3, and pH-5: Dye
degradation improves over time, with pH-5 showing the highest efficiency (96% at 50 minutes) compared to pH-3 (91%) and pH-1 (88%).
For Pure CeO2, prominent diffraction peaks were observed at 20 values of 28.70°, 33.23°, 47.64°, and 56.57°, which correspond to the (111), (200), (220), (311), and (222) crystallographic planes of the ceria phase. The calculated average crystallite size for Pure CeO2 was 19.29 nm, and the lattice parameter was determined to be 17.585 Å. In contrast, CeO2 synthesized at pH 5 exhibited diffraction peaks at similar 20 values of 28.70°, 33.23°, 47.67°, 56.57°, and 59.24°, indexed to the same crystallographic planes. The average crystallite size of the CeO2 synthesized at pH 5 was slightly larger, measuring 25.43 nm. These findings suggest that the synthesis conditions, specifically the pH, influence the crystallite size of CeO2 nanoparticles, though the overall crystal structure remains consistent.
The overall peak broadening is the sum of the contributions of the crystal size and the strain current in the material. From Figure 1 The W–H equation for the uniform purpose model is given by [45].
β(hkl)cos0(hkl) = k × λ/Dv4e sin0(hkl) (2)
where, β(hkl) s is the FWHM, 0 is Bragg’s bending angle, k is the shape feature, λ is the wavelength of radioactivity, Dv is the volumeweighted crystallite size, and e is the lattice strain. The crystal-like size is obtained from the intercept value of the plot [46]. The crystal-like size of the manufactured CeO2 NPs by sol–gel was found to be 19.29 nm and CeO2 pH-5. The lattice parameter calculated from the (111) reflection plane of the manufactured CeO2 NPs and CeO2 pH-5 is calculated by the formula [47].
![]()
The calculated lattice parameters of the CeO2 nanoparticles synthesized by the sol–gel method is shown in Table 1, where d represents the spacing and (h k l) are the Miller indices.
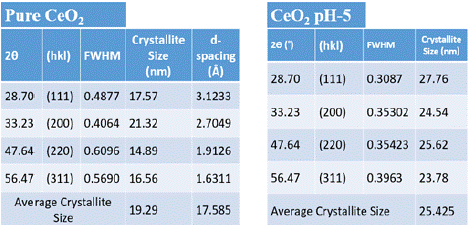
    Table 1: Calculated element size of Pure CeO2 and CeO2pH-5. The table
shows that CeO2 pH-5 has larger crystallite sizes (average: 25.43 nm) and
higher crystallinity (lower FWHM) compared to pure CeO2 (average: 19.29
nm).
The average crystallite size of synthesized CeO2 was calculated by using Debye- Scherer’s formula and the Williamson–Hall (W–H) method [47,48].
Debye sherrer formula used to determine crystal size
![]()
Where k = 0.9 is constant and = 0.154nm is constant. D-spacing found by the Bragg’s law equation which is
![]()
FTIR Spectroscopy
To analyze the surface properties of the samples, Fourier Transform Infrared (FTIR) spectroscopy was used to provide detailed information about their chemical composition, functional groups, and molecular characteristics. Figure 3 displays the FTIR spectra of the four samples. The FTIR spectrum of the CeO2 gel dried at 75°C shows five distinct absorption bands at 1341, 1066, 851, 834, and 716 cm-¹. The band at 1341 cm-¹ corresponds to O-H group vibrations, while the band at 1066 cm-¹ is linked to bending vibrations of bound water. The peak at 851 cm-¹ is associated with C-N stretching vibrations from urea, and the band at 834 cm-¹ reflects the deformation mode of ammonium ions formed during the breakdown of urea. The band at 716 cm-¹ is related to Ce-O-C stretching vibrations in the precursor gel. At 600°C, the spectrum retains the bands at 1341 cm-¹ and 1066 cm-¹, indicating the persistence of hydroxyl groups and bound water, as shown in Figure 3a. The FTIR spectrum of CeO2 gel synthesized at pH 5 and dried at 75°C exhibited a consistent pattern, with five prominent bands at 1341, 1066, 851, 834, and 716 cm-¹. These bands align with previously reported results for CeO2 gels. The band at 1341 cm-¹ is attributed to O-H stretching vibrations, while the 1066 cm-¹ band corresponds to the bending vibrations of bound water. The 834 cm-¹ band is associated with C-N stretching vibrations from urea, and the 716 cm-¹ band is linked to Ce-O-C stretching vibrations. Even after heating the sample to 600°C, the bands at 1341 cm-¹ and 1066 cm-¹ remain, confirming the persistence of hydroxyl groups and bound water, as shown in Figure 3b.
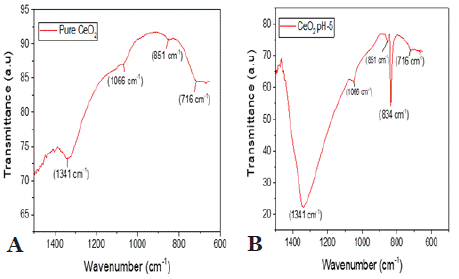
    Figure 3: illustrates the FTIR spectra of CeO2 (a) and CeO2 pH-5 (b),
highlighting notable differences in surface chemistry and structure. In graph
(a), CeO2 exhibits a strong Ce-O stretching peak between 500–700 cm-¹ and
a broad O-H stretching band around 3400 cm-¹, indicating a higher presence
of surface hydroxyl groups and a more hydrated or less crystalline structure.
In contrast, graph (b) for CeO2 pH-5 shows sharper and more distinct Ce-O
peaks with reduced O-H intensity, suggesting improved crystallinity and
fewer surface hydroxyl groups due to the pH-adjusted synthesis. These
variations imply potential differences in catalytic or adsorption properties
between the two samples.
Raman Spectroscopy
Figure 4 illustrates the Raman spectra of CeO2 nanoparticles, comparing two samples: (a) Pure CeO2 and (b) CeO2 synthesized at pH 5. The Raman shift range spans from 200 to 1000 cm-¹, with key peaks providing insights into the structural characteristics of the nanoparticles.
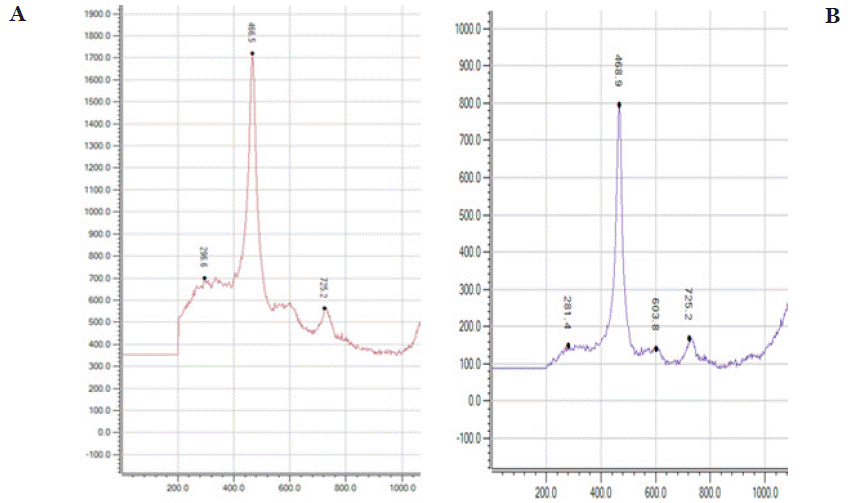
    Figure 4: shows the Raman spectra of Pure CeO2 (a) and CeO2 pH-5 (b) nanoparticles. Both samples exhibit a strong peak around 465 cm-¹, characteristic of
the F2g mode of CeO2 fluorite structure. In graph (a), Pure CeO2 shows higher intensity, suggesting better crystallinity. In graph (b), CeO2 pH-5 exhibits slightly
lower intensity and broader peaks, indicating structural defects or smaller particle size due to pH-modified synthesis. These differences reflect variations in
crystallinity and defect density, which can influence the material’s functional properties.
For the Pure CeO2 sample Figure 4a, a dominant and sharp Raman peak is observed at 466.5 cm-¹, attributed to the F2g vibrational mode, which is characteristic of the fluorite-type cubic structure of CeO2. This mode corresponds to the symmetric stretching vibration of the Ce–O bond, confirming the crystallinity of the material. Additional minor peaks appear at lower intensities, likely due to structural imperfections or secondary vibrational modes. In the CeO2 synthesized at pH 5 Figure 4b, a similar sharp peak is present at approximately 468.9 cm-¹, indicating that the fluorite-type crystal structure is maintained. However, slight shifts in the peak position and intensity suggest subtle changes in the lattice environment, potentially caused by variations in synthesis conditions, such as pH. Minor peaks, including those at 281 and 725.2 cm-¹, may be related to defects or additional vibrational modes introduced during synthesis under acidic conditions. These observations confirm the structural integrity of CeO2 nanoparticles and highlight the sensitivity of the F2g mode to synthesis parameters, making it a critical feature for analyzing the structural properties of CeO2.
Surface Morphology (SEM)
To examine the surface morphology of Pure CeO2 and CeO2 synthesized at pH 5, scanning electron microscopy (SEM) was employed. The SEM micrographs of both Pure CeO2 and CeO2 synthesized at pH 5, calcined at 600°C, are displayed in Figure 5a & 5b. The images clearly demonstrate that all samples exhibit a spherical morphology. A notable variation in particle size is observed, which is influenced by changes in the pH during the synthesis of the nanosols. Specifically, CeO2 synthesized at pH 5 tends to form larger particles compared to Pure CeO2, which exhibits smaller, more uniform particles. The average particle size of the CeO2 nanoparticles, as evidenced by the SEM micrographs, correlates with the crystallite size derived from X-ray diffraction (XRD) analysis using the Debye- Scherrer equation. Although the particles primarily maintain a spherical shape, some degree of agglomeration is evident, especially in Pure CeO2, where particles tend to aggregate, leading to the formation of larger particle clusters, as shown in Figure 6a & 6b.
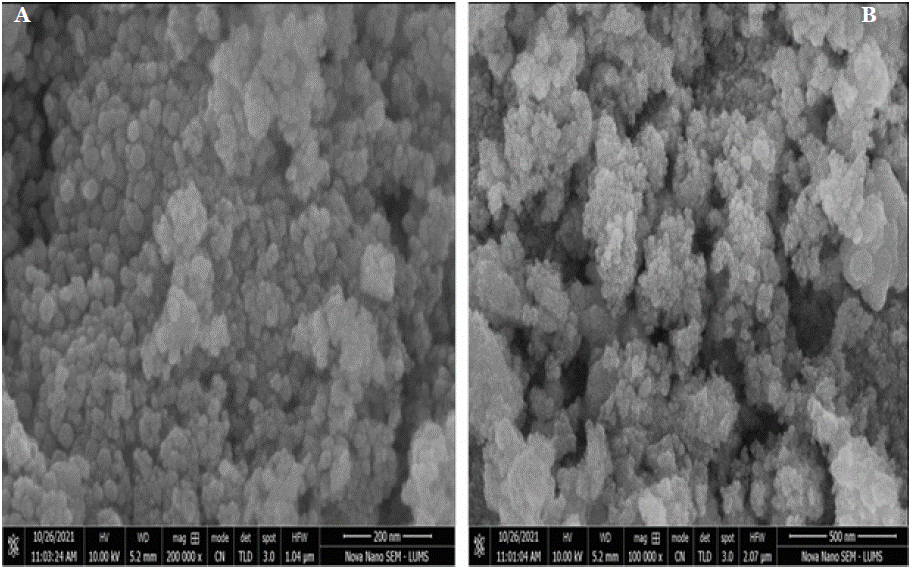
    Figure 5a & 5b: presents the SEM analysis of CeO2 calcined at 600°C, revealing the morphology of the nanoparticles. The images demonstrate a uniform
distribution of spherical and agglomerated nanoparticles with porous structures, suggesting high surface area. These features indicate potential suitability for
catalytic and adsorption applications.
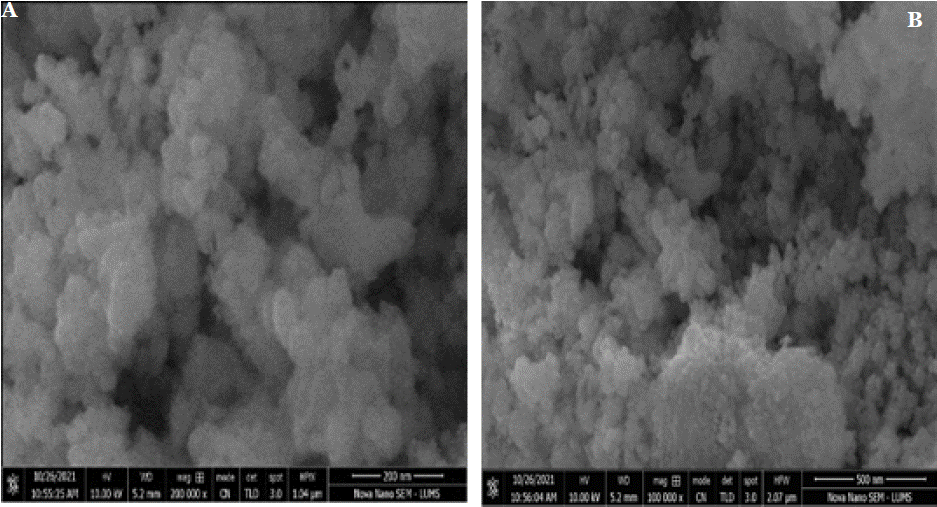
    Figure 6a & 6b: shows the SEM analysis of CeO2 pH-5 calcined at 600°C, revealing a porous and agglomerated structure with smaller, less-defined nanoparticles
compared to pure CeO2. The morphology suggests increased surface defects and higher surface area, which may enhance catalytic and adsorption properties.
Uv-Ultraviolet visible spectroscopy
Photocatalytic Activity Evaluation: The photocatalytic activity of the synthesized cerium oxide nanomaterials was methodically appraised by investigative key limitations, including the initial pH of the methyl Blue (MB) explanation, the photocatalyst's pH, the initial attentiveness of MB, exposure time, and photocatalyst dosage. Direct and indirect valuations were conducted, preliminary with testing the materials on methyl blue under numerous pH conditions (acidic, neutral, and basic). For this, 2 mg of the nanoparticles were dispersed in 10 mL of methyl blue solution and unprotected to sunlight for 2 hours. Results revealed effective photocatalytic degradation across pH-1, pH-3, pH-5, and pH-7, with optimal performance observed in a basic medium, importance the material's improved effectiveness under alkaline situations as show in Figure 7.
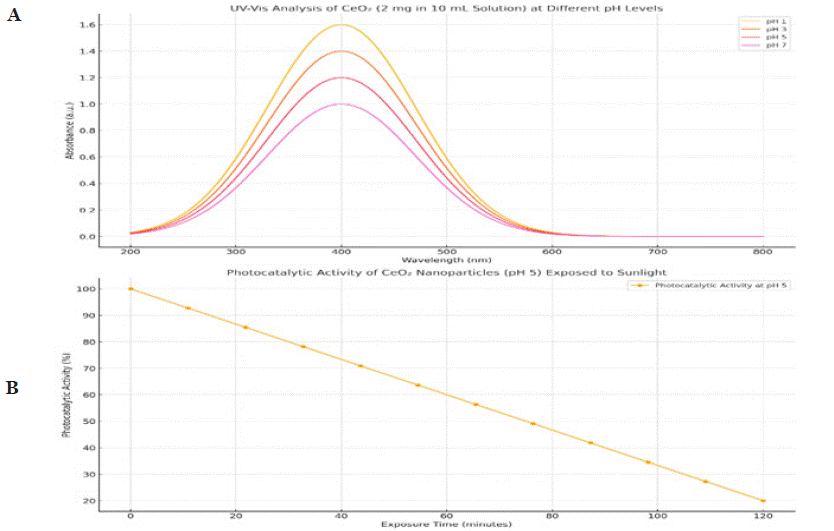
    Figure 7: presents the UV-Vis analysis of CeO2 nanoparticles at pH levels 1, 3, 5, and 7. The absorption intensity increases with decreasing pH, peaking
around 300–400 nm, indicating higher light absorption at lower pH. The photocatalytic activity (pH 5) under sunlight exposure shows a significant degradation of
absorbance over 120 minutes, demonstrating effective photocatalytic performance influenced by pH.
Effect of Initial pH of Methyl Blue Solution: The pH of wastewater in the textile industry is influenced by the chemical additives used in dye processing, as well as the type of dyes employed [49]. In this study, the pH of the methyl Blue (MB) dye solution was adjusted using NaOH and HCl, while the substance dosage was maintained at 2 mg/10 mL, the dye concentration at 20 mg/L, light intensity at a constant level, and contact time set to 1 hour. Figure 8a presents the photocatalytic consequences, illustrating the effect of solution pH on dye degradation.
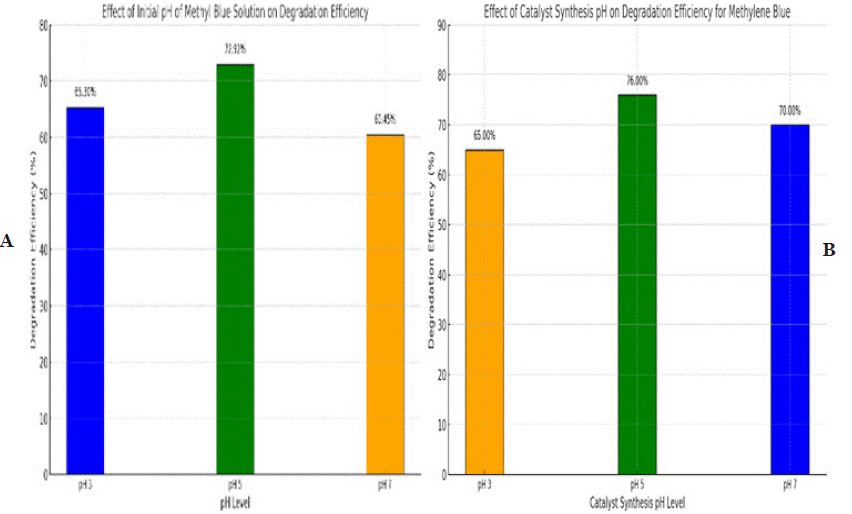
    Figure 8a & 8b: highlights the impact of pH on the degradation efficiency of methylene blue. In graph (a), the initial pH of the solution significantly affects
degradation, with the highest efficiency observed at pH 5 (72.97%), while lower efficiencies are recorded at pH 3 (63.33%) and pH 7 (60.45%), indicating that
mildly acidic conditions are optimal. In graph (b), the pH during catalyst synthesis plays a crucial role, as catalysts synthesized at pH 5 achieve the highest
degradation efficiency (78.00%) compared to those synthesized at pH 3 (65.00%) and pH 7 (70.00%). These findings emphasize the critical influence of pH in
both the reaction environment and catalyst preparation on the overall photocatalytic performance.
The results show that the degradation efficiency of cerium oxide (CeO2) nanoparticles varies with the pH of the MB solution. The catalyst particles were found to be sensitive in acidic (pH 5), basic (pH 3), and neutral (pH 7) conditions, reliable with preceding studies on other metal oxides [50]. The highest degradation efficiency was experiential in acid media, as the manufacture of hydroxyl radicals (OH-) is improved in acidic circumstances, thereby indorsing photocatalytic activity [51]. In acid surroundings, the substance surface becomes protonated (H+), which enhances the electrostatic magnetism between the destructively emotional methyl orange molecules and the substance surface. This communication facilitates the development of electron-hole pairs, important to the following degradation of the dye [52,53]. As shown in Figure 8b, the highest dilapidation efficiency, 72.92%, was achieved in acidic media (pH 5).
Effect of Catalyst pH: The influence of catalyst pH on the photocatalytic action for the poverty of methylene blue dye is shown in Figure 8b. It was experimental that the degradation efficiency mixed with changes in the pH of the catalyst. The photocatalytic experiments were conducted under conditions of a 2 mg/10 mL catalyst dose, a dye solution pH of 5, and 60 minutes of sunlight experience. The experiential disparity in degradation productivity can be credited to the variations in the particle size of CeO2 [54,55]. Ceria synthesized at pH 5 confirmed the highest degradation effectiveness, likely due to its smaller particle size associated to ceria nanoparticles synthesized at other pH values, as established by XRD and SEM analysis. The smaller particle size increases the number of energetic sites on the substance surface, thereby enhancing the superficial area and, accordingly, the photocatalytic action [56]. The better availability of vigorous sites facilitates the group of free extremists, which play a critical role in the poverty of organic pollutants [57]. Photocatalytic developments are essential for the actual photodegradation of organic compounds [2]. Figure 8b shows the degradation efficiency, where methylene blue dye was degraded by approximately 76% using CeO2 synthesized at pH 5 under direct sunlight exposure. This catalyst is mentioned to as the optimized CeO2 nanoparticles (NPs) in succeeding discussions.
Effect of Exposure Time: The absorption spectra of a 20 ppm dye solution after each 20-minute interval of sunlight exposure are shown in Figure 9. The results demonstrate that the degradation efficiency is directly proportional to the exposure time [58]. The dye solution exhibited the most rapid degradation within the first 20 minutes of exposure, with the degradation rate gradually cumulative thereafter. The maximum dye degradation efficiency was achieved after 50 minutes of sunlight contact, using the optimized CeO2 nanoparticles (2 mg/10 mL dose) as the photocatalyst.
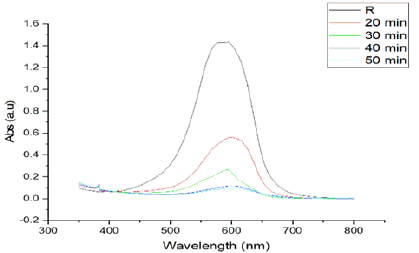
    Figure 9: Illustrates the effect of time exposure on the photocatalytic
degradation of a solution. The absorbance peak at around 600 nm decreases
progressively with increased exposure time (20, 30, 40, and 50 minutes),
indicating continuous degradation of the target compound over time. This
demonstrates the effectiveness of the photocatalytic process with extended
exposure.
Figure 9 presents the degradation efficiency at each time interval, with a maximum degradation of approximately 75% experiential after 50 minutes of exposure. Initially, the photocatalytic response proceeds rapidly due to the high availability of active sites on the substance surface, which improves the development rate of electron-hole pairs [2]. However, over extended exposure periods, by products may accumulate on the active sites of the photocatalyst, leading to surface deactivation. As a result, the photocatalytic activity diminishes due to increased recombination of electron-hole pairs during longer contact times [59]. The decrease in dye solution absorbance and the consistent increase in dilapidation productivity over time are depicted in Figure 9.
Effect of Catalyst Dosage on Photocatalytic Degradation: The impact of CeO2 nanoparticle dosage on the degradation of a 10 ppm methylene blue (MB) solution was measured by varying the catalyst dosage from 0.5 mg to 6 mg per 10 mL of solution. To evaluate the efficiency of the synthesized nanoparticles, the photocatalytic degradation of methylene blue at concentrations of 10, 20, 40, and 60 ppm was performed under ultraviolet (UV) radiation and sunlight, with varying power and wavelengths on sunny days. In one experiment, 2 mg of catalyst was added to 10 mL of methylene blue solution, and the sample was exposed to direct sunlight for 120 minutes. After exposure, UV-Visible spectroscopy was conducted to analyze the degradation efficacy. The results indicated that the deprivation efficiency amplified with the catalyst dosage, reaching an optimum at 2 mg. Beyond this dosage, the degradation efficiency plateaued, indicating that increasing the catalyst amount further does not significantly enhance degradation. This plateau in efficiency can be attributed to the saturation of active catalytic sites and scattering effects caused by the excess catalyst, which limit photon preoccupation and reduce the overall effectiveness of the photocatalytic process. These findings highlight the importance of enhancing catalyst dosage to achieve efficient degradation while avoiding unnecessary material usage in Figure 10.
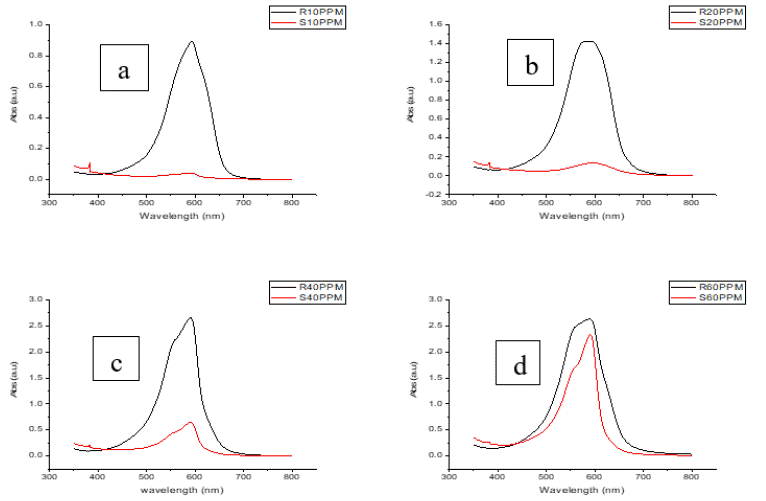
    Figure 10: Illustrates the UV-Vis spectra for photocatalytic degradation at different concentrations of the degrader: 10 ppm, 20 ppm, 40 ppm, and 60 ppm. The peak
around 600 nm, representing the target compound, decreases significantly at 10 ppm, indicating high degradation efficiency. As the concentration increases to 20
ppm, 40 ppm, and 60 ppm, the peak intensity reduces more gradually, reflecting a decline in photocatalytic performance due to limited active sites and saturation
effects at higher concentrations. This highlights the inverse relationship between degrader concentration and photocatalytic efficiency.
Time-Dependent Photocatalytic Degradation: The degradation of a 20 ppm MB solution was monitored over time intervals of 20, 30, 40, and 50 minutes under direct sunlight exposure. The degradation efficiency increased with exposure time, with significant dye degradation occurring within the first 30 minutes. After 50 minutes, the MB degradation efficiency reached approximately 80%, indicating that prolonged exposure to sunlight enhances the degradation process. The degradation of a 20 ppm MB solution was monitored over time intervals of 20, 30, 40, and 50 minutes under direct sunlight exposure. The degradation efficiency increased with exposure time, with significant dye degradation occurring within the first 30 minutes. After 50 minutes, the MB degradation efficiency reached approximately 80%, indicating that prolonged exposure to sunlight enhances the degradation process in Figure 11.
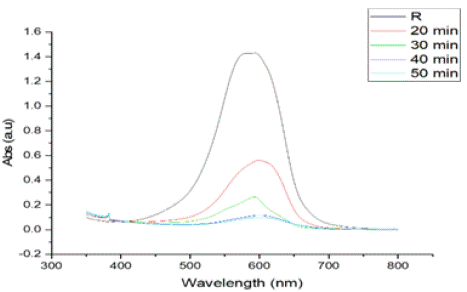
    Figure 11: Illustrates the UV-Vis analysis of photocatalytic degradation over
time, showing a distinct absorbance peak around 600 nm, corresponding
to the target compound. The peak intensity decreases progressively with
time—starting from the reference (R) to 20, 30, 40, and 50 minutes—
indicating continuous breakdown of the compound. The reduction in peak
height reflects the effectiveness of the photocatalytic process, with longer
exposure leading to greater degradation.
Mechanism of Photocatalysis: CeO2 nanoparticles disruption down methyl blue (MB) through a multi-layered process that syndicates corporeal and catalytic adsorption actions. CeO2 nanoparticles professionally adsorb MB molecules through a range of interactions, including electrostatic bonding and van der Waals forces, thanks to their large external area. Following adsorption, CeO2 nanoparticles act as catalysts, promoting the generation of superoxide activists and ROS like hydroxyl [60]. It is critical that CeO2 be able to cycle between the oxidation states of Ce (III) and Ce (IV). Oxygen situations on the CeO2 surface facilitate redox events, which aid in degradation [61]. By responding directly with MB particles, the resultant ROS (very reactive substances) liquefy them into less destructive byproducts. Furthermore, CeO2 nanoparticles might be photocatalytic, which would boost the rate of degradation when visible to light [62]. Additionally, CeO2 nanoparticles might be photocatalytic, which would increase the rate of degradation when visible to light. The mutual effects of adsorption, catalysis, and redox responses account for the general efficacy of CeO2 nanoparticles in eradicating organic pollutants like MB in Figure 11.
Dye Degradation Percentage:
Dye Degradation (%) =
Where; Co= Initial Conc. Of MB and Ct= Conc. After time “t”. (Table 2)
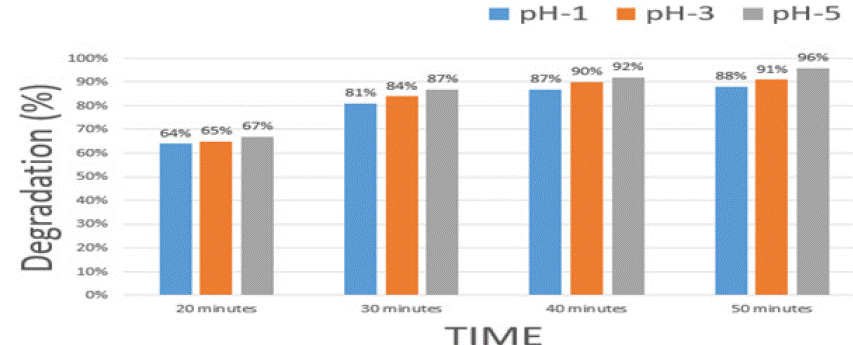
    Table 2: Time series Dye Degradation Percentage. Table shows the percentage of dye degradation over time for samples at pH-1, pH-3, and pH-5: Dye
degradation improves over time, with pH-5 showing the highest efficiency (96% at 50 minutes) compared to pH-3 (91%) and pH-1 (88%).
Conclusions
In this study, ceria (CeO2) nanoparticles were effectively synthesized using the sol-gel technique. The resultant nanoparticles showed sphere-shaped morphology, good crystallinity, and element sizes in the range of 22 to 27 nm. These nanoparticles established photocatalytic movement under both acidic and basic conditions. The photocatalytic show of the CeO2 nanoparticles was originate to be influenced by several factors, including catalyst loading, initial methyl blue (MB) concentration, pH of the MB wastewater, and revelation time. Among the many CeO2 samples, the nanoparticles manufactured at pH 5 displayed the peak photocatalytic efficiency. This superior performance was accredited to the smaller particle size and a greater number of lively sites on the catalyst surface. Under enhanced conditions, a maximum of 75% degradation of MB was realized within 50 minutes of sunlight revelation. Kinetic studies revealed that the degradation process followed both first- and secondorder models, with the first-order kinetic model providing a better fit for the optimized system.
References
- Ahmed T, et al. Emerging nanotechnology-based methods for water purification: a review. 2014; 52: 4089-4101.
- Channei D, et al. Photocatalytic degradation of methyl orange by CeO2 and Fe–doped CeO2 films under visible light irradiation. 2014; 4: 5757.
- Sajid MM, et al. Efficient photocatalytic and antimicrobial behaviour of zinc oxide nanoplates prepared by hydrothermal method. 2022: 1-11.
- Tao X, et al. CeO2 photocatalysts derived from Ce-MOFs synthesized with DBD plasma method for methyl orange degradation. 2019; 805: 1060-1070.
- Khan MM, SF Adil and AJJoSc Al-Mayouf. Metal oxides as photocatalysts. Elsevier. 2015; 462-464.
- Hisatomi T, J Kubota and KJCSR Domen. Recent advances in semiconductors for photocatalytic and photoelectrochemical water splitting. 2014; 43: 7520- 7535.
- Hoffmann MR, et al. Environmental applications of semiconductor photocatalysis. 1995; 95: 69-96.
- He J, et al. Superoxide/peroxide chemistry extends charge carriers’ lifetime but undermines chemical stability of CH3NH3PbI3 exposed to oxygen: timedomain ab initio analysis. 2019; 141: 5798-5807.
- Li S-H, et al. A sustainable approach for lignin valorization by heterogeneous photocatalysis. 2016; 18: 594-607.
- Lee J, PJS-Gpfc Gouma. Energy, Sol-gel processed oxide photocatalysts. 2012: 217-237.
- Behpour M, et al. Photocatalytic Aactivity Of Tio2/Ag Nanoparticle On Degradation Of Water Pollutions. 2010; 5.
- Lu M, et al. Photocatalytic activity and mechanism of cerium dioxide with different morphologies for tetracycline degradation. 2023; 936: 168273.
- Luo Z, et al. Ceria nanoparticles as an unexpected catalyst to generate nitric oxide from S-nitrosoglutathione. 2022; 18: 2105762.
- Cui D. et al. A novel fluidized-bed-electrode solid-oxide-fuel-cell reactor for N2O catalytic decomposition. 2023; 466: 143123.
- Pouretedal H and AJCJoC Kadkhodaie. Synthetic CeO2 nanoparticle catalysis of methylene blue photodegradation: kinetics and mechanism. 2010; 31: 1328-1334.
- Gadge S, et al. Sonocatalytic degradation of methylene blue using spindle shaped cerium oxide nanoparticles. 2023; 27: 2005-2015.
- Natrayan L, et al. Explore the elimination of toxic dye using Bio-Synthesized cerium oxide nanoparticles derived from Morinda citrifolia leaf extracts. 2023; 41: 103151.
- Matussin SN, MH Harunsani and MMJJoRE Khan. CeO2 and CeO2-based nanomaterials for photocatalytic, antioxidant and antimicrobial activities. 2023; 41: 167-181.
- Kalaycioglu Z, et al. Efficient photocatalytic degradation of methylene blue dye from aqueous solution with cerium oxide nanoparticles and graphene oxide-doped polyacrylamide. 2023; 8: 13004-13015.
- Druzian DM, et al. Cerium oxide nanoparticles: Biosynthesis, characterization, antimicrobial, ecotoxicity and photocatalytic activity. 2023; 442: 114773.
- Liu Z, et al. Construction of CeO2/CdS heterostructure and study on photocatalytic mechanism of rhodamine B degradation. 2024; 34: 175-189.
- Patil SS, et al. A Negative Effect of Niobium-Doped Ceria on Soot Oxidation Activity. 2022; 45: 517-525.
- Vibhu V, et al. Electrochemical ageing study of mixed lanthanum/ praseodymium nickelates La2-xPrxNiO4+ d as oxygen electrodes for solid oxide fuel or electrolysis cells. 2020; 46: 62-70.
- Khan SA, et al. Cellulose acetate-Ce/Zr@ Cu0 catalyst for the degradation of organic pollutant. 2020; 153: 806-816.
- Li S, et al. Morphological effect of CeO2 catalysts on their catalytic performance in lean methane combustion. 2020; 49: 461-464.
- Zito CA, et al. Low-temperature carbon dioxide gas sensor based on yolk– shell ceria nanospheres. 2020; 12: 17745-17751.
- Chen Y, et al. Development of mesoporous SiO2/CeO2 core/shell nanoparticles with tunable structures for non-damage and efficient polishing. 2020; 46: 4670-4678.
- Wen J, et al. Fabrication of dense gadolinia-doped ceria coatings via verylow- pressure plasma spray and plasma spray–physical vapor deposition process. 2019; 9: 717.
- He HJIF. Preparation and dispersion of nanosize ceria in high electrolyte slurry by ball-milling. 2015; 161: 36-44.
- Hussain S, et al. CuO-decorated MOF derived ZnO polyhedral nanostructures for exceptional H2S gas detection. 2023; 317: 137827.
- El Shaer SS, et al. In vivo ameliorative effect of cerium oxide nanoparticles in isoproterenol-induced cardiac toxicity. 2017; 69: 435-441.
- Bumajdad A, et al. Microemulsion-based synthesis of CeO2 powders with high surface area and high-temperature stabilities. 2004; 20: 11223-11233.
- Machmudah S, et al. Synthesis of Ceria zirconia oxides using solvothermal treatment. in MATEC Web of Conferences. 2018; EDP Sciences.
- Tok AIY, et al. Hydrothermal synthesis of CeO2 nano-particles. 2007; 190: 217-222.
- Gnanam S, VJJos-gs Rajendran. Technology, Synthesis of CeO2 or a–Mn2O3 nanoparticles via sol–gel process and their optical properties. 2011; 58: 62- 69.
- Charbgoo F, MB Ahmad and MJIjon Darroudi. Cerium oxide nanoparticles: green synthesis and biological applications. 2017: 1401-1413.
- Abdulwahab KO, MM Khan and JRJAo Jennings. Doped ceria nanomaterials: preparation, properties, and uses. 2023; 8: 30802-30823.
- Rajeshkumar S and PJBR Naik. Synthesis and biomedical applications of cerium oxide nanoparticles–a review. 2018; 17: 1-5.
- Gilani SAB, et al. pH dependent synthesis of ceria nanoparticles for efficient sunlight-driven photocatalysis of methyl orange containing wastewater. 2024; 148: 114871.
- Lyu Y, et al. Reaction paths of methane activation and oxidation of surface intermediates over NiO on Ceria-Zirconia catalysts studied by In-situ FTIR spectroscopy. 2021; 404: 334-347.
- Periyat P, et al. A facile aqueous sol–gel method for high surface area nanocrystalline CeO2. 2011; 1: 1794-1798.
- Adnan S, et al. Solar energy potential in Pakistan. 2012; 4.
- Hussain S, et al. Unique polyhedron CeO2 nanostructures for superior formaldehyde gas-sensing performances. 2018; 44: 19624-19630.
- Wei X, et al. Synthesis, Characterization, and Photocatalysis of Well- Dispersible Phase.Pure Anatase TiO2 Nanoparticles. 2013; 2013: 726872.
- Kurian M and CJINL Kunjachan. Investigation of size dependency on lattice strain of nanoceria particles synthesised by wet chemical methods. 2014; 4: 73-80.
- Pujar MS, et al. Synthesis of cerium-oxide NPs and their surface morphology effect on biological activities. 2020; 43: 24.
- Muthuvel A, et al. Green synthesis of cerium oxide nanoparticles using Calotropis procera flower extract and their photocatalytic degradation and antibacterial activity. 2020; 119: 108086.
- Prieur D, et al. Size dependence of lattice parameter and electronic structure in CeO2 nanoparticles. 2020; 59: 5760-5767.
- Tariq M, M Ali and ZJS Shah. Characteristics of industrial effluents and their possible impacts on quality of underground water. 2006; 25: 64-69.
- Amu-Darko JNO, et al. Highly sensitive In2O3/PANI nanosheets gas sensor for NO2 detection. 2023; 11: 109211.
- Zhao H, G Zhang and QJUs Zhang. MnO2/CeO2 for catalytic ultrasonic degradation of methyl orange. 2014; 21: 991-996.
- Tang H, et al. Investigation onto the performance and mechanism of visible light photodegradation of methyl orange catalyzed by M/CeO2 (M= Pt, Ag, Au). 2021; 144: 111497.
- Yu L, et al. The degradation mechanism of methyl orange under photocatalysis of TiO2. 2012; 14: 3589-3595.
- Hussain S, et al. Robust TiN nanoparticles polysulfide anchor for Li–S storage and diffusion pathways using first principle calculations. 2020; 391: 123595.
- Khan SB, et al. Effect of particle size on the photocatalytic activity and sensing properties of CeO2 nanoparticles. 2013; 8: 7284-7297.
- Saquib M, et al. Photocatalytic degradation of two selected dye derivatives in aqueous suspensions of titanium dioxide. 2008; 219: 301-311.
- Jayakumar G, et al. Particle size effect on the properties of cerium oxide (CeO2) nanoparticles synthesized by hydrothermal method. 2017; 9.
- Daneshvar N, et al. Photocatalytic degradation of azo dye acid red 14 in water on ZnO as an alternative catalyst to TiO2. 2004; 162: 317-322.
- Li Y, et al. Kinetic study and model of the photocatalytic degradation of rhodamine B (RhB) by a TiO2-coated activated carbon catalyst: Effects of initial RhB content, light intensity and TiO2 content in the catalyst. 2008; 142: 147-155.
- Elahi B, et al. Preparation of cerium oxide nanoparticles in Salvia Macrosiphon Boiss seeds extract and investigation of their photo-catalytic activities. 2019; 45: 4790-4797.
- Sabouri Z, et al. Plant-based synthesis of cerium oxide nanoparticles using Rheum turkestanicum extract and evaluation of their cytotoxicity and photocatalytic properties. 2022; 37: 555-568.
- Ma R, et al. A critical review on visible-light-response CeO2-based photocatalysts with enhanced photooxidation of organic pollutants. 2019; 335: 20-30.