
Research Article
Austin J Clin Ophthalmol. 2014;1(4): 1020.
Correlation between Fourier-Domain Optical Coherence Tomography Parameters and HbA1c Level and Diabetes Duration in Early Stage Diabetic Retinopathy
Toshiyuki Oshitari*, Sakiko Nonomura, Miyuki Arai, Takayuki Baba and Shuichi Yamamoto
Department of Ophthalmology and Visual Science, Chiba University Graduate School of Medicine, Japan
*Corresponding author: Toshiyuki Oshitari, Department of Ophthalmology and Visual Science, Chiba University Graduate School of Medicine, Inohana 1-8-1, Chuo-ku, Chiba 260-8670, Chiba
Received: April 15, 2014; Accepted: May 10, 2014; Published: May 13, 2014
Abstract
We examined a significant correlation between Fourier–domain optical coherence tomography (FD–OCT) parameters and the glycosylated hemoglobin A1c (HbA1c) level and duration of diabetes mellitus (DM) in patients at the early stage of diabetic retinopathy (DR). Thirty eyes of 30 patients with early stage DR that were examined at the Chiba University Hospital were studied. The macular map 5 (MM5), the retinal nerve fiber layer thickness, and the ganglion cell complex thickness were obtained by FD–OCT. The coefficients of correlation between these parameters and the HbA1c level and the DM duration were determined by Spearman rank correlation. The thickness of the inferior sector of the outer ring of the MM5 was significantly correlated with the HbA1c level. The superior sector and the temporal sector of the outer ring were significantly correlated with the DM duration. Our findings suggest that the significant positive correlation between the retinal thickness of the sectors in the outer ring and the HbA1c level and DM duration may be due to a subclinical increase of the vascular permeability. A swelling of Müller cells may have also contributed to the correlation because their density is known to be higher in the perifoveal area than the central area.
Keywords: Fourier–Domain; HbA1c; Diabetes; Retinopathy
Introduction
Growing evidence indicate that neuronal abnormalities, including both the death of retinal ganglion cells (RGCs) and vascular abnormalities, are associated with the pathogenesis of early stage diabetic retinopathy (DR) [1,2]. Because the neuronal damages are irreversible, therapies for neuroprotection should be developed to protect the retina before the neuronal and vascular abnormalities develop in patients with DR [3]. The therapies should be sensitive, easy to implement, and be able to be monitored so that the abnormalities can be detected and followed at the early stage of DR [4].
Both vascular abnormalities, e.g., pericyte loss [5,6] and basement membrane thickening [7,8], and neuronal abnormalities, e.g., death of RGCs [9,10] are known to be induced by chronic high glucose exposure in vitro. To monitor the retinal changes in the early stage of DR, it would be better to correlate the retinal changes with systemic measures of the degree of diabetes, e.g., hyperglycemia by the glycosylated hemoglobin A1c (HbA1c) level. However, this would mean drawing blood each time a determination is made. Thus, a noninvasive method to monitor the degree of DR would be better.
Optical coherence tomography (OCT) is a useful non–invasive method of detecting and monitoring early retinal changes in eyeswith DR [11–15]. Because the RGCs are known to be the first neurons to be altered at the early stage of DR [14], it would be important to know what parameters of the RGCs could be used to detect the early changes of the DR. It has been established that a reduction of the thickness of the retinal nerve fiber layer (RNFL) is an early sign of DR [16]. Thus, measurements of the thickness of the RNFL as well as that of other retinal layers may be useful in detecting eyes at the early stage of DR.
Fourier–domain OCT (FD–OCT, RTVue–100) can obtain higher resolution images of the retina than time–domain OCT. The RTVue–100 has a 5 µm axial resolution and a scan rate of 26,000 axial scans⁄sec. In addition, the RTVue–100 has software embedded that can provide 5 macular maps (MM5), the thickness of the RNFL, andthe thickness of the ganglion cell complex (GCC) [17–19]. Thus, theRTVue–100 can be useful for determining whether eyes at the earlystage of DR have distinct pathognomonic features of early stage DR.
The purpose of this study was to measure three parameters embedded in the RTVue–100; MM5, RNFL thickness, and GCCthickness in patients with early stage DR. We calculated the coefficients of correlation between these parameters and the HbA1c level and theduration of the diabetes mellitus (DM). We then discuss the possible pathological mechanisms that led to the early retinal changes.
Materials and Methods
Thirty eyes of 30 patients with early stage DR, also referred to as non–DR (NDR) or mild non–proliferative (NPDR) that wereexamined at the Chiba University Hospital from December 2011 to March 2013 were studied. A written informed consent was signed by all patients, and all of the procedures conformed to the tenets of the World Medical Association Declaration of Helsinki. An approval for this study was obtained from the Institutional Review Board of Chiba University Hospital.
All of the participants had a routine ophthalmological examination. Both eyes were examined by FD–OCT (RTVue–100; Optovue Inc, Fremont, CA, USA) after pupillary dilation, and three parameters were determined. The first was the MM5 which consisted of an outer 5×5 mm grid of 11 horizontal and 11 vertical lines obtained by 668 A–scans each and an inner 3×3 mm grid of 6 horizontal and 6 vertical lines obtained by 400 A–scans each (Figure 1). The second parameter was the RNFL thickness map which was calculated from the images of 6 circular and 12 linear scans along a 3.45–mm diameter circle around the optic disc (Figure 2), and the third parameter was thickness of the GCC which was calculated from a 7×7 mm grid of the macula 1–mm temporal to the fovea (Figure 3).
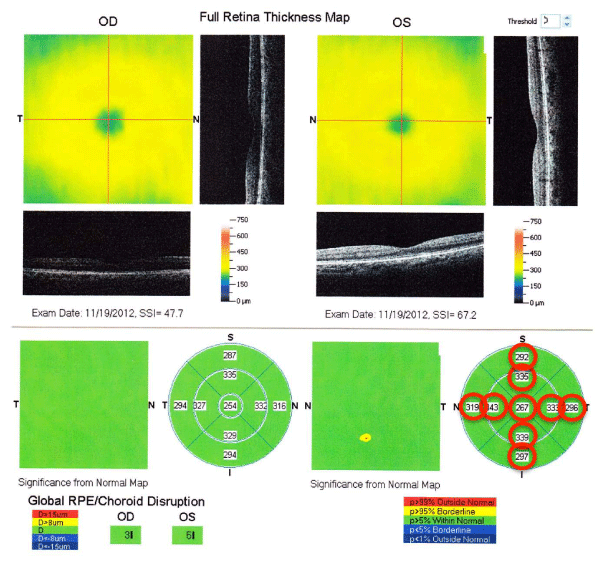
Figure 1 :Representative data sheet for the MM5 determined by RTVue-100. The parameters surrounded with red circles were used in this study.
The MM5 was divided into 9 areas with the central area defined as a 1 mm diameter circle centered on the fovea. The other areas consisted of an inner ring and an outer ring; the inner ring had an inner diameter of 1 mm and an outer diameter of 3 mm, and the outer ring had an inner diameter of 3 mm and an outer diameter of 5 mm. The inner and outer rings were divided into 4 sectors; the superior, nasal, temporal, and inferior sectors (Figure 1). The average thickness of the nine sectors was used for the statistical analyses (Figure 2). The RNFL thickness was determined by the optic nerve head mode of the RTVue–100.
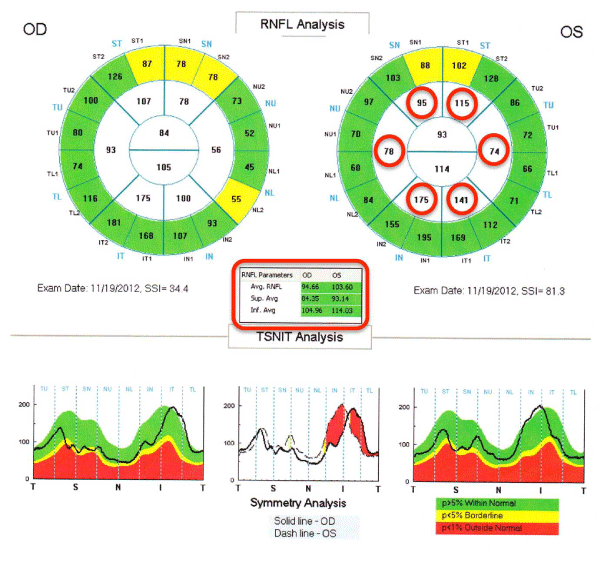
Figure 2:Representative data sheet of RNFL measured by RTVue-100. The parameters surrounded by red circles were selected for the statistical analysis of this study.
The GCC thickness was defined as the distance from the internal limiting membrane to the boundary of the outer inner plexiformlayer. In addition to the calculated mean thicknesses, two patternbased diagnostic parameters were used; focal loss volume (FLV) was computed as the total sum of statistically significant GCC volumeloss divided by the GCC map area, and global loss volume (GLV) computed as the sum of the negative fractional deviation in the entire area (Figure 3).
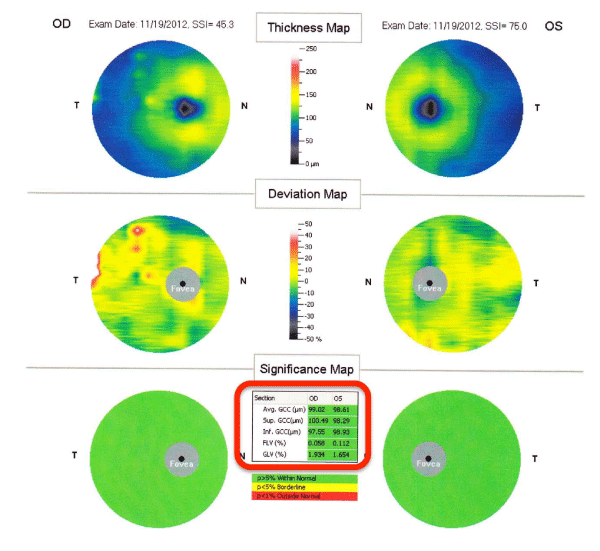
Figure 3 : Representative data sheet of GCC measured by RTVue-100. The parameters surrounded with red circles were analyzed in this study. FLV; Focal Loss Volume, GLV; Global Loss Volume.
This was a cross sectional study, and all examinations includingthe OCT recordings were performed on the same day. The participantshad no other ocular diseases including diabetic macular edema and no history of surgeries. Eyes with refractive errors (spherical equivalents) between +3.0 diopters (D) and –6.0 D were studied. Images withsingle strength index <35 were excluded. The data of the left eyes were used for the statistical analysis, but if the left eyes did not meet the inclusion criteria, the right eyes were used for the statistical analysis [20].
The clinical data of the participants are shown in Table 1. The HbA1c levels were determined within three month of the OCT measurements. The coefficients of correlation between three parameters and the HbA1c levels and the DM duration were analyzed with the Spearman rank correlation. All data are expressed as the means ± standard deviations (SDs). Stat View 5.0 software was used for the statistical analyses. A P <0.05 was considered significant.
![]()
Age
DM duration
Gender
IOP
DM stage
HbA1c
Medication
DM type
(years)
(years)
(mmHg)
(%)
62.2�13.3
9.2�6.2
Male 22 Female��� 8
14.8�3.0
NDR 20 NPDR��� 10
7.3�1.6
Diet 3
Type I 1
Oral 15
Type II 26
Insulin 12
Others 3
Table 1: Clinical data and features.
Results
The mean age of the patients was 62.2 ± 13.3 years, and there were of 22 men and 8 women. Twenty (66.7%) of the patients had NDR and 10 (33.3%) had mild NPDR. Most of the patients (86.7%) were diagnosed with type II DM (Table 1).
The MM5, RNFL, and GCC findings and the coefficients of correlation between these three parameters and the HbA1c levels and duration of the diabetes are shown in Tables 2,3, and 4. Our data showed that the coefficients of correlation between the GCC and theRNFL parameters and the HbA1c level were not significant (Tables 2 and 3). However, the thickness of the inferior sector in the outer ring (mean = 275.9±18.1 µm) was significantly correlated with the HbA1c level (P=0.046, RS=0.371; Table 4).
![]()
GCC parameters
mean�SD
Rs vs. HbA1c
P value vs. HbA1c
Rs vs. DM duration
P value vs. DM duration
Ave.GCC (⟩m)
89.2�7.3
0.151
0.4214
0.251
0.212
Sup.GCC (⟩m)
88.7�7.9
0.058
0.7615
0.263
0.1887
Inf.GCC (⟩m)
89.7�7.3
0.188
0.3147
0.202
0.3284
FLV (%)
2.1�1.8
0.082
0.6649
0.092
0.7104
GLV (%)
10.0�5.9
-0.145
0.4248
-0.199
0.2143
Table 2: Coefficient of correlation between GCC parameters and HbA1c level and DM duration.
![]()
RNFL thickness
Mean(⟩m)�SD
Rs vs. HbA1c
P value vs. HbA1c
Rs vs. DM duration
P value vs. DM duration
Ave. RNFL
97.9�11.9
-0.048
0.79
-0.013
0.9441
Sup. Ave
96.0�13.7
-0.131
0.4746
0.139
0.5282
Inf. Ave
99.8�13.6
0.084
0.6545
-0.201
0.2121
Nasal-Sup
115.4�22.2
-0.018
0.913
0.169
0.4303
Nasal
69.6�12.5
0.169
0.3684
0.05
0.8962
Nasal-Inf
125.5�22.9
0.297
0.1109
-0.237
0.146
Temp-Inf
136.7�34.2
-0.108
0.5553
-0.161
0.3016
Temp
76.4�14.3
-0.005
0.9631
-0.014
0.8188
Temp-Sup
116.4�21.9
-0.212
0.2474
0.207
0.3181
Table 3: Coefficient of correlation between RNFL parameters and HbA1c level and DM duration.
![]()
MM5 parameters
Mean(⟩m)�SD
Rs vs. HbA1c
P value vs. HbA1c
Rs vs. DM duration
P value vs. DM duration
Center
258.5�24.6
-0.113
0.5353
0.071
0.8028
Inner-Sup
310.0�16.8
0.05
0.7977
0.252
0.2108
Inner-Nasal
314.5�14.6
0.044
0.8204
0.377
0.0521
Inner-Inf
305.9�17.3
0.039
0.8443
0.6308
0.113
Inner-Temp
302.3�18.9
-0.062
0.7286
0.234
0.2507
Outer-Sup
276.0�17.7
0.01
0.9689
0.468
*0.0145
Outer-Nasal
293.0�16.6
0.126
0.5026
0.285
0.152
Outer-Inf
276.0�18.1
0.371
*0.0463
0.175
0.4104
Outer-Temp
277.9�14.6
0.112
0.5326
0.439
*0.0224
Table 4: Coefficient of correlation between MM5 parameters and HbA1c level and DM duration.
The average values of GCC, RNFL, and MM5, and the coefficients of correlation between three parameters and the DM duration are shown in Tables 2–4. All of the GCC and RNFL parameters were not significantly correlated with the DM duration. However, the MM5 parameters, the superior sector of the outer ring (mean = 276.0±17.7µm) and the temporal sector of the outer ring (mean = 277.9±14.6µm) were significantly correlated with the DM duration (P = 0.015, RS = 0.468; P = 0.022, RS = 0.439, respectively).
Discussion
The results of our earlier study with the Stratus OCT showed that the thickness of the center area of the macula and that of the RNFL at the early stage of DR were thinner than that of non–diabetic controls obtained with the same instrument. We suggested that the difference in the thickness was due to both neuronal and vascular abnormalities that were present at the early stage of DR [13]. However, the resolution of Stratus OCT is limited, and the quality of images of the outer ring area was poorer than those in the central area [21]. Thus, we did not analyze the data of the outer ring in the statistical evaluations. Because RTVue–100 (FD–OCT) can provide better axial resolution than Stratus OCT (time–domain OCT), the data of the outer ring area of the MM5 parameters were could be used for statistical evaluations.
We found that only the retinal thickness of outer MM5 sectors were significantly correlated with the HbA1c level and the DM duration. These early changes probably developed earlier and were more sensitive to DM stress because they were correlated with the HbA1c level and they were all significantly and positively correlated. Thus, the retinal thickness of the outer ring area thickened with increasing DM duration and increasing HbA1c level. These early changes were most likely not due to neuronal abnormalities. One possibility is that the thickening of the outer ring of MM5 may be due to a subclinical increase of vascular permeability. Similar changes were also observed in our earlier study; an early reduction of the macular thickness due to neuronal degeneration was masked by an increase in macular thickness associated with subclinical vascular leakage [13].
Another possibility for the significant positive correlation between the thickness of the outer ring of the MM5 sector and level of the HbA1c and DM duration may be a swelling of the Müller cells because the percentage of the area of Müller cells is higher in the outer area than in the central area of the retina [22]. Earlier findings suggested that the swelling of Müller cells in eyes with diabetic retinopathy is due to osmotic swelling caused by oxidativestress and mitochondrial dysfunction [23]. A recent clinical study showed that the thicker inner nuclear layer may be due to Müller cell activity accompanied by neuronal cell loss in eyes with early diabetic retinopathy [12]. Although the swelling of Müller cell probably does not have a direct link to apoptotic pathways for the neuronal cell death in diabetic retinopathy [24], Müller cell abnormalities are related to hyperglycemia and can be secondarily associated with the development and the progression of retinal neuronal damage [25,26]. Taken together, our findings indicate that the FD–OCT parameters may be useful for detecting and monitoring retinal changes at the early stage of DR.
On the other hand, the results of the parameters associated with RGC death, viz., the thickness of the RNFL and GCC, were not significantly correlated with the HbA1c level and diabetes duration. In glaucoma patients, the RNFL and GCC parameters are known to be sensitive and highly specific for detecting glaucomatous eyes [17]. This is contrary to our results, and we cannot conclude that the RNFL and GCC parameters are useful for monitoring neuronal abnormalities in early diabetic retinopathy. Further investigations are needed to find other parameters to evaluate neuronal abnormalities at the early stage of DR.
Conclusion
Although the conclusions of this study are tentative because this was a cross sectional study and the number of the participants was small, the significant correlation between the retinal thickness of the outer areas of the MM5 sectors and HbA1c level and DM duration may be due to a subclinical increase of vascular permeability or Müller cell swelling induced by early diabetic stress. Our results may give a clue to elucidate the early pathological changes at the early stage of DR.
Acknowledgement
This study is supported by a Grant–in Aid from the Ministry ofEducation, Science, Sports and Culture of the Japanese Government and the grant from The Eye Research Foundation for the Aged. We thank Professor Duco Hamasaki of the Bascom Palmer Eye Institute of the University of Miami for discussions and editing the manuscript.
References
- Oshitari T, Hata N, Yamamoto S. Endoplasmic reticulum stress and diabetic retinopathy. Vasc Health Risk Manag. 2008; 4: 115-122.
- Hernández C, Simó R. Neuroprotection in diabetic retinopathy. Curr Diab Rep. 2012; 12: 329-337.
- Oshitari T, Roy S. Common therapeutic strategies for diabetic retinopathy and glaucoma. Curr Drug Ther. 2007; 2: 224-232.
- Stem MS, Gardner TW. Neurodegeneration in the pathogenesis of diabetic retinopathy: molecular mechanisms and therapeutic implications. Curr Med Chem. 2013; 20: 3241-3250.
- Bakillah A, Guillot R, Urios P, Grigorova-Borsos AM, Sternberg M. Stimulating effect of growth hormone on type IV collagen production by endothelial cells cultured in normal and high glucose. Amino Acids. 2012; 43: 697-707.
- Devi TS, Hosoya K, Terasaki T, Singh LP. Critical role of TXNIP in oxidative stress, DNA damage and retinal pericyte apoptosis under high glucose: implications for diabetic retinopathy. Exp Cell Res. 2013; 319: 1001-1012.
- Chronopoulos A, Trudeau K, Roy S, Huang H, Vinores SA. High glucose-induced altered basement membrane composition and structure increases trans-endothelial permeability: implications for diabetic retinopathy. Curr Eye Res. 2011; 36: 747-753.
- Oshitari T, Polewski P, Chadda M, Li AF, Sato T, Roy S. Effect of combined antisense oligonucleotides against high-glucose- and diabetes-induced overexpression of extracellular matrix components and increased vascular permeability. Diabetes. 2006; 55: 86-92.
- Costa GN, Vindeirinho J, Cavadas C, Ambrósio AF, Santos PF. Contribution of TNF receptor 1 to retinal neural cell death induced by elevated glucose. Mol Cell Neurosci. 2012; 50: 113-123.
- Oshitari T, Yoshida-Hata N, Yamamoto S. Effect of neurotrophic factors on neuronal apoptosis and neurite regeneration in cultured rat retinas exposed to high glucose. Brain Res. 2010; 1346: 43-51.
- Biallosterski C, van Velthoven ME, Michels RP, Schlingemann RO, DeVries JH, Verbraak FD. Decreased optical coherence tomography-measured pericentral retinal thickness in patients with diabetes mellitus type 1 with minimal diabetic retinopathy. Br J Ophthalmol. 2007; 91: 1135-1138.
- Vujosevic S, Midena E. Retinal layers changes in human preclinical and early clinical diabetic retinopathy support early retinal neuronal and müller cells alterations. J Diabetes Res. 2013; 2013: 905058.
- Oshitari T, Hanawa K, Adachi-Usami E. Changes of macular and RNFL thicknesses measured by Stratus OCT in patients with early stage diabetes. Eye (Lond). 2009; 23: 884-889.
- van Dijk HW, Kok PH, Garvin M, Sonka M, Devries JH, Michels RP, et al. Selective loss of inner retinal layer thickness in type 1 diabetic patients with minimal diabetic retinopathy. Invest Ophthalmol Vis Sci. 2009; 50: 3404-3409.
- van Dijk HW, Verbraak FD, Kok PH, Stehouwer M, Garvin MK, Sonka M, et al. Early neurodegeneration in the retina of type 2 diabetic patients. Invest Ophthalmol Vis Sci. 2012; 53: 2715-2719.
- Park HY, Kim IT, Park CK. Early diabetic changes in the nerve fibre layer at the macula detected by spectral domain optical coherence tomography. Br J Ophthalmol. 2011; 95: 1223-1228.
- Garas A, Vargha P, Holló G. Diagnostic accuracy of nerve fibre layer, macular thickness and optic disc measurements made with the RTVue-100 optical coherence tomograph to detect glaucoma. Eye (Lond). 2011; 25: 57-65.
- Kim NR, Lee ES, Seong GJ, Kim JH, An HG, Kim CY. Structure-function relationship and diagnostic value of macular ganglion cell complex measurement using Fourier-domain OCT in glaucoma. Invest Ophthalmol Vis Sci. 2010; 51: 4646-4651.
- Sull AC, Vuong LN, Price LL, Srinivasan VJ, Gorczynska I, Fujimoto JG, et al. Comparison of spectral/Fourier domain optical coherence tomography instruments for assessment of normal macular thickness. Retina. 2010; 30: 235-245.
- Oshitari T, Hanawa K, Adachi-Usami E. Macular and retinal nerve fiber layer thickness in Japanese measured by Stratus optical coherence tomography. Clin Ophthalmol. 2007; 1: 133-140.
- Oshitari T, Mitamura Y. Optical coherence tomography for complete management of patients with diabetic retinopathy. Curr Diabetes Rev. 2010; 6: 207-214.
- Nishikawa S, Tamai M. Müller cells in the human foveal region. Curr Eye Res. 2001; 22: 34-41.
- Krügel K, Wurm A, Pannicke T, Hollborn M, Karl A, Wiedemann P, et al. Involvement of oxidative stress and mitochondrial dysfunction in the osmotic swelling of retinal glial cells from diabetic rats. Exp Eye Res. 2011; 92: 87-93.
- Curtis TM, Hamilton R, Yong PH, McVicar CM, Berner A, Pringle R, et al. Müller glial dysfunction during diabetic retinopathy in rats is linked to accumulation of advanced glycation end-products and advanced lipoxidation end-products. Diabetologia. 2011; 54: 690-698.
- Puro DG. Diabetes-induced dysfunction of retinal Müller cells. Trans Am Ophthalmol Soc. 2002; 100: 339-352.
- Gardner TW, Antonetti DA, Barber AJ, LaNoue KF, Levison SW. Diabetic retinopathy: more than meets the eye. Surv Ophthalmol. 2002; 47 Suppl 2: S253-262.