
Research Article
Austin J Biosens & Bioelectron. 2024; 9(1): 1049.
Honeycomb-Inspired SERS Nano-Bowls for Rapid Capture and Analysis of Extracellular Vesicles
Sathi Das1; Jean-Claude Tinguely2,/; Eduarda M Guerreiro3; Omri Snir3; Kanchan Saxena4; Balpreet Singh Ahluwalia2*; Dalip Singh Mehta1#
1Bio-photonics and Green Photonics Laboratory, Indian Institute of Technology Delhi, India
2Department of Physics and Technology, UiT the Arctic University of Norway, India
3Thrombosis Research Group (TREC), Institute of Clinical Medicine, UiT - The Arctic University of Norway, India
4Amity Institute of Renewable and Alternative Energy, Amity University Uttar Pradesh, India
*Corresponding author: Balpreet Singh Ahluwalia, Department of Physics and Technology, UiT The Arctic University of Norway, Tromsø, 9037, Norway, India. Email: balpreet.singh.ahluwalia@uit.no; mehtads@ physics.iitd.ac.in
Received: November 06, 2024; Accepted: November 29, 2024; Published: December 06, 2024
Abstract
Extracellular Vesicles (EVs) are produced by each cell for communication and carry molecular signatures of the host cell. Therefore, the analysis of EVs is essential for disease detection and prediction of the state of host cells. We employ an Ag-coated nano-bowl PDMS substrate for molecular analysis of distinct EVs isolated from different cell types using Surface Enhanced Raman spectroscopy (SERS). The local field enhancement of the optimized SERS substrate was evaluated using the 3D Finite Difference Time Domain (FDTD) simulation that exhibits a high local field due to the cavity geometry. Apart from Raman signal enhancement, the nano-bowl-based substrate having large curvature restricts the Brownian motion of EVs at suspension, facilitating reproducible signal enhancement. The overall study demonstrates the utilization of the SERS technique as a label-free, rapid and sensitive analysis of EVs.
Keywords: Plasmonic trap; Biomarker; Malignant leukemia cells; Raman spectra
Introduction
EVs are nanobodies confined by lipid bilayer membranes which are naturally produced by all kind of cells, and carry diverse biochemical loads of proteins, lipids, and nucleic acids (i.e., RNA and DNA) [1]. EVs display a biological complexity and diverse heterogeneity according to their origin. Adequate analysis of the composition and biochemical load of EVs may thus provide critical information towards their exploitation for personalized medicine, disease prediction and diagnosis [2]. These vesicles include a diverse range of biomolecules including proteins, nucleic acids, and lipids, which resemble the composition of their parent cells [3]. For instance, tumor-derived EVs are composed of tumor-specific chemicals, making them suitable candidates for use as biomarkers in tumor diagnosis. Furthermore, EVs in blood plasma show great potential as a liquid biopsy source and could provide valuable insights into the molecular properties of early-stage melanomas [4]. Therefore, the characterization of EVs is crucial for disease diagnostics. However, detection of circulating EVs is complex due to their very small size (~100 nm), and potential chance of mixing with other proteins and molecules of similar dimensions [5]. Several methodologies have been explored to characterize the biomarkers carried by EVs. These methodologies include ELISA, WB, NTA, to mention a few. However, they do not come without draw backs such as consumption of a considerable amount of sample, sample processing, to name a few [6]. Therefore, it is essential to develop a method that can accurately and simultaneously characterize numerous EVs in a highly sensitive manner and address the current obstacles as well as enable the utilization of EVs as reliable biomarkers for the early disease detection.Recently various advanced nanophotonic and nanoelectronics approaches have been proposed for the detection of biofluids and biomarkers corresponding to diseases. For instance, Liu et al detected hepatic cell fate marker albumin in vitro and living cell labeling with up conversion nanoparticles (UCNPs), which are conjugated with Antibody (Ab) and Rose Bengal Hexanoic Acid (RBHA) [7]. Xu et al reported single-crystal patterned graphenesheet into Graphene Field-Effect Transistor (G-FET) biosensor that detected imatinib at as low as 15.5 fM [8]. However, these techniques require addition instrumentation and does not give the information of molecular energy label. Raman spectroscopy offers molecular fingerprint of samples in terms of its vibrational energy level [9]. The technique requires a small amount of samples and does not require external tagging process. However, the biomolecules exhibit inherently low Raman signal intensity, requiring high laser power and long integration time, that could lead to potential damage of molecules [10]. Surface Enhanced Raman Spectroscopy (SERS) is a popular technique that enhances the low Raman signal intensity and enables detection of analytes at low concentrations. The enhancement in SERS occurs due to the light trapping activity of metallic (Ag or Au) nanostructures at nanoscale [11]. Briefly, the trapped electric field generates hotspot regions around the vicinity of the nanostructures at the Localized Surface Plasmon Resonance (LSPR) condition. In this way, the analyte molecule localized on hotspots exhibits enhanced Raman signal. SERS is already being employed for the detection of a diverse set of molecules for chemical, and biomedical applications [9,12]. For example, Das et al detected different species and strains of pathogenic bacteria using Si nanowire SERS chip and machine learning [13]. Li et al have reported a micro-extraction SERS membrane made of gold@silver nanoparticles (Au@AgNPs) and CuO Nanospikes (NSs) on polymethyl methacrylate (PMMA) and detected microcystin–LR up to 5 × 10⁻⁶ μg/L [14]. Wang et al detected the serum extracellular vesicles for detection of early melanomas [15]. Yang et al distinguished EVs from different biological sources based on the SERS signatures collected using a graphene-covered Au coated quasi-periodic array of pyramids [16]. However, most of the existing literature reports the spectra of dried EVs since the EVs in suspension exhibit high Brownian motion hindering reliable in-focal measurements. Drying of EVs can lead to membrane modification, change in protein content and is prone to supplying false spectral information due to membrane alteration [17,18]. Therefore, it is desirable to perform SERS measurements of EVs in suspension to capture their chemical morphology. A few attempts towards trapping of EVs have been described, making use of a plasmonic tweezer, microfluidic set up, surface topology assisted passive trapping etc [19-23]. Among these, surface topology assisted passive trapping methodology restricts the high Brownian motion of bioparticles and passively traps the particle facilitating in-focal measurements [21,24]. Different surface topologies such as curved surfaces using nanopore, nanocavity, nano-bowl have been explore for passive trapping [24]. Here, the surface barriers of the structured surface restrict the motion of particles in the lateral plane (XY plane) and the incident laser assists in restricting the motion along the axial plane (Z-plane). Another advantage of such structured surfaces it that it also provides a larger surface area for additional plasmonic enhancement.
In this work, we described the SERS activity of plasmonic nanobowl surface and demonstrated the utility of the SERS substrate for label-free characterization of EVs in suspension state. The nanobowl surface topology is fabricated using a monolayer Polystyrene (PS) beads template. The topology of the PDMS surface resembles a honeycomb which is suitable for SERS enhancement due to its larger surface area compared to a flat substrate. Apart from the enhanced hotspot regions, it exhibits high surface barriers that could provide potential trap-sites for bio-nanocarriers. In this context, distinct EVs derived from three different malignant leukemia cells (HAP1, HAP1- F3KO, and THP1), were analyzed using the developed method to explore molecular signatures of EVs and the associated cell of origin. The THP1 cell line is a monocytic cell line commonly used to model macrophage functions, intercellular communication, and signaling [25]. The HAP1 cell has one copy of the chromosome, making it a valuable model for genetic research. HAP1 F3KO cells are genetically engineered HAP1 cells without the tissue factor (F3) gene, which has an essential role in blood coagulation [26]. Thus, the EVs derived from the mentioned cell lines contain a variety of biomolecules from the host cell, which helps find out the role of intercellular communication and disease diagnosis.
Experimental
The honeycomb inspired PDMS nano-bowl was fabricated and optimized using nanosphere lithography technique, as previously described [24,27]. Briefly, a 2.5% Polystyrene (PS) bead suspension (size: 1 μm) was spin coated on a plasma treated glass plate. The coated glass plates were subsequently submerged at an oblique angle into 4% Sodium Dodecyl Sulfate (SDS) in DI water. The hydrophobic solution repelled PS beads and a controlled immersion process led to the formation of a monolayer at the air-water interface. The floating monolayer of PS beads was scooped using a clean Si wafer and kept on a hot plate at 1100C for 20 min for increased adhesion. The PS beads template was further spin coated with PDMS solution at 800 rpm for 20 s and subsequently cured at 700C for 2 hours. Finally, the cured PDMS was peeled off and washed with dichloromethane and DI water to remove any beads residue.
To coat with Ag, the structured PDMS was placed inside a sputter coater (Cressington 208HR) for an optimized coating of 40 nm.
Isolation and Characterization of Extracellular Vesicles
Three million cells, Haploid human cell line (HAP1) and its derivative TF-knock out cell line (HAP1-F3KO) both from Horizon Discovery Ltd., were seeded in T-175 flasks in 40 ml IMDM+10% FCS. Cells were incubated overnight at 37°C, 5%CO2 and cell culture media was replaced by 40 ml IMDM + 10% exosome free FBS. Cells were incubated for 24 hours at 37°C, 5%CO2. Next, the culture media was collected and EVs were isolated by sequential centrifugation. Briefly, cell culture media was centrifuged at 300xg for 5 min in a 5810 Eppendorf centrifuge, swing bucket rotor A-4-81. Supernatant was transferred to a fresh tube and centrifuged at 2.500xg for 10 min in a 5810R Eppendorf centrifuge, swing bucket rotor A-4-81. Pellet was discarded and the supernatant was loaded into 50 mL, Polycarbonate Bottle with Screw-On Cap (Beckman Coulter) and centrifuged for 20.000xg for 30 min, 4°C in an Avanti J-26 XP centrifuge (Beckman Coulter) equipped with JA-25.50 fixed angle rotor. EVs were resuspended in 900 μl of 20 mM HEPES, 150 mM NaCl buffer and stored at -80°C until use.
THP1 monocytic cell line (American Type Culture Collection, ATCC) were cultured in 20 ml of RPMI+5% exosome free FCS in T-75 flasks, 37°C, 5%CO2. Fifteen ml of cell suspension were collected and centrifuged 250gx for 5 min. Supernatant was transferred to a fresh tube and centrifuged at 2500xg for 10 min in a 5810 Eppendorf centrifuge, swing bucket rotor A-4-81 to remove cell debris. Next, 30 ml of cell culture supernatant were pooled and concentrated in an Amicon-Ultra 15 Centrifugal filter units (Ultracel-50, Merck Millipore) centrifuging at 4,000rpm for 10 min in a Megafuge 1.0 (Heraeus Sepatech) centrifuge equipped with a swing bucket rotor BS4402/A. The concentrated cell culture media was loaded into a pre-washed 10 ml Sepharose CL-2B (GE Healthcare Bio-Sciences) size exclusion chromatography column. Sample was allowed to enter the column matrix and PBS was added continuously. The eluate was collected in 15 sequential fractions of 0.5 ml each. Protein quantification was used to identify the EV-rich fractions, which were then pooled and stored at -80°C until use.
Enumeration and Characterization of Extracellular Vesicles
Isolated EVs were characterized for particle concentration and size distribution using a ZetaView® PMX110 nanoparticle tracking analyser (Particle Metrix GmbH) equipped with a 488nm laser. EVs were diluted in PBS to obtain a particle concentration within the range 106 – 108 particles/ml. Data analysis was carried out with ZetaView (version 8.05.14 SP7) software. The presence of classical EV markers was carried out by bead-based flow cytometry analysis using CD9, CD81, and CD63 capture beads. Detection was carried out using a tetraspanin antibody mix (labeled with PE. Signal was acquired by flow cytometry using a CytoFLEX flow cytometer (Beckman Coulter, Indianapolis, USA) and data was analyzed using CytExpert 2.0 (Beckman Coulter, Indianapolis, USA) software.
Determination of Plasmonic Enhancement using 3D FDTD Simulation
3D Finite Difference Time Domain (FDTD) simulations using Lumerical software were performed to investigate the distribution of hotspots with an enhanced electric field. The simulation model was constructed using a simplified model of the nano-bowl structure as an inverted hemisphere having a diameter of 550 nm, as characterized from FESEM images. The thickness of Ag coating was set to be 40 nm. The refractive index of PDMS was set to 1.43, and the refractive index of Ag taken from the Palik data set [11]. The simulation geometry was considered for a single bowl to restrict the simulation memory requirements. The incident laser profile was chosen to be Gaussian, with an excitation wavelength of 532 nm, a bandwidth of ±5 nm and propagating in the –Z direction. The simulation domain was set to Perfectly Matched Layer (PML) boundary conditions. The mesh size was kept auto-nonuniform, and the override region closing the entire nano-bowl was set to 3 nm for all dimensions. The frequency-domain field profile monitors were utilized to check the local electric field map at various planes of the nanostructure.
Spectra Acquisition Methodology
To acquire the Raman spectra in suspension state, the fabricated SERS film was plasma treated and a 1.5 μm thick rectangular PDMS chamber positioned on top of the SERS substrate. 5μL of the sample solution was cast inside the chamber and sealed using a glass coverslip from the top. The sealed solution was characterized with a Renishaw In-Via Micro Raman spectrometer (100X, 0.85 NA). A 532 nm excitation laser, 10 mW laser power, and 30 s integration period were used for each SERS measurement. To conduct additional analysis, the acquired spectra were background removed and baseline corrected. The SERS spectra of each sample was collected multiple times considering the same spot and different spots on the sample solution placed on a substrate.
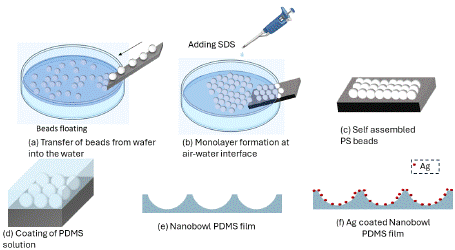
    Figure 1: Schematic representation of the fabrication of the PDMS SERS
chip. a) The monolayer PS beads float at the air-water interface in the
hydrophobic SDS solution. b) The bead monolayer is scooped onto a fresh
Si wafer. c) Self assembled bead monolayer on the Si wafer. d) To create
nano-bowl structure from the PS beads template, the coated wafer is spin
coated with PDMS for soft lithography. e) Cured PDMS peeled off from the
template. This process leads to the fabrication of nano-bowl surface topology
on PDMS film. f) Structured PDMS coated with Ag for SERS activity.
Results and Discussions
Morphology of Nano-Bowls
Figure 2 (a) depicts an FESEM image and (b) the corresponding histogram plot of the nano-bowl diameters obtained from 1 μm PS beads.
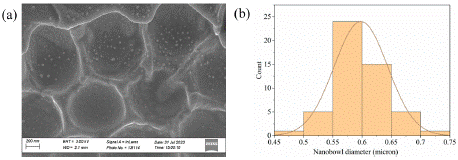
    Figure 2: (a) FESEM image of nano-bowl cured from monolayer PS beads
template. (b) Histogram plot of nano-bowl diameters of the corresponding
substrate.
Local field enhancement
Next, we investigated the amount of plasmonic enhancement offered by the optimized nano-bowl geometry. Figure 3 (a) shows the schematic diagram FDTD simulation set-up, and Fig. 3 (b) reveals the local field map along the YZ plane for the optimized SERS substrate. The reason for the SERS enhancement in nano-bowl structures is the ability to produce enhanced electric field due to curvature induced focusing of electromagnetic field [28]. The curved structure, acting as a lens, focuses the laser light spot tightly creating higher intensity of hotspots compared to the flat surface [29]. The shape anisotropy of the Ag-PDMS film also induces a higher density of hotspots compared to a flat film due to increased surface area.
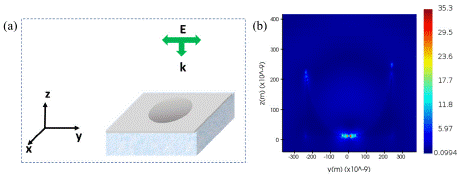
    Figure 3: (a) Schematic presentation of the FDTD simulation set up. (b) Local
field distribution of Ag-coated PDMS nano-bowl substrate. The simulation
shows enhanced local field due to shape anisotropy.
Passive Trapping Activity of Nano-Bowl
We propose the surface-topology assisted trapping of EVs inside the nano-bowl. Rapid passive retention activity by the nano bowl morphology has previously been demonstrated for synthetic bio-nanoparticles in previous work by the authors [24]. Briefly, the nano-bowl shape naturally guides EVs towards its the center of the nano-bowl, confined in XY plane. For the Z-direction, the incident laser will apply momentum to the EVs towards the surface and help to stabilize the analytes within the focal spot of the nano-bowls, thereby improving the capture efficiency during measurement.
Characterization of EVs
EVs isolated from HAP1, HAP1-F3KO, and THP1 cell lines had a similar size with an average mode size of 161.6±77.1, 157.66±77.1, and 166.3±69.9 nm (Figure 4 A), respectively. Particle concentration was 5.8x10⁸ particles/ml for EVs derived from HAP1. EVs from HAP1- F3KO were at 6.9 x10⁸ particles/ml while the ones from THP1 were at 2.4 x10⁸ particles/ml. Analysis of the expression of common EV tetraspanin markers (Figure 4B) showed that the EVs were positive for CD63, CD81, and CD9.
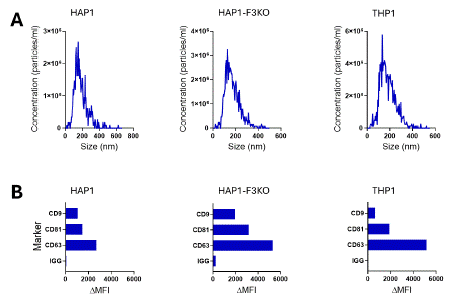
    Figure 4: A. Size distribution of EVs isolated from HAP1, HAP1-F3KO,
and THP1 cell lines. B. Analysis of common EV tetraspanin markers (CD9,
CD81, and CD63) by means of bead-based flow cytometry.
SERS Spectra of EVs
SERS spectra were acquired from EVs isolated from three distinct cell lines, THP-1, HAP1, and HAP1-F3KO. as shown in Figure 5 (a). The THP1-derived EVs show distinct spectral features, with a peak at 809 cm-1 attributed to nucleic acid. The SERS peaks are assigned at 1264 cm-1 for lipids, 1322 cm-1 for proteins, 1409 cm-1 for lipids, 1447 cm-1 for proteins and lipids, and 1620 cm-1 for proteins [30]. The intensity bar plot at 1264, 1409, and 1620 cm-1 are depicted for THP1- derived EVs. HAP1-derived EVs show unique spectral features at 916 cm-1 attributed to nucleic acid, 1171, 1354, 1566, and 1612 cm-1 for protein. The SERS spectra of HAP1-F3KO-derived EVs exhibit Raman peak at 788 cm-1, indicating the pyrimidine ring of nucleic acid. The shift at 880 cm-1 is assigned to proteins, 1264 cm-1 showing Amide III protein, 1140, and 1411 cm-1 for protease protein, respectively. The HAP1-F3KO derived EVs offer enhanced spectra at 1000, 1265 cm-1 for lipids, 1169, 1352, 1411, 1515, and 1606 cm-1 for proteins, respectively. The Raman shifts and corresponding biomolecules are listed in Table 1. Figure 5 (b-d) represents an intensity variation plot considering 15 different measurements from three distinct EVs.
![]()
    Raman shift (cm-1)
    Assigned vibrational modes
    Biomolecules


    643-645
    Tyrosine
    Proteins


    700-704
    cholesterol
    Lipids


    717
    C-N+ stretching
    Phospholipids


    810-812
    Stretching (O-P-O)    phosphodiester
    Nucleic acid A type helix


    1000-1004
    Phenylalanine
    Protein


    1050-1130
    C-C stretching
    Lipids


    1155-1160
    Stretching (C-C) of polyene
    Carotenoids


    1175-1177
    Tyrosine
    Protein


    1207-1210
    Phenylalanine (F3),    Tyrosine (Y3)
    ’’


    1230-1305
    Amide III
    ’’


    1260-1270
    C-H2 distortion in    acyl chain
    Lipid


    1295-1305
    ’’
    ’’


    1300-1350
    Tryptophan
    Protein


    1435-1465
    Distorsion    C-H2, C-H3
    Protein, Lipids


    1450-1490
    Guanine ring Purine A
    Nucleic acids


    1515-1540
    Stretching polyene
    Carotenoids


    1550-1555
    Tryptophan
    Proteins


    1570-1580
    A, G ring
    Nucleic acids


    1602-1604
    Ergosterol
    Lipids


    1615-1617
    Tyrosine (Y1)
    ’’


    1619-1621
    Tryptophan (W1)
    ’’


    1650-1670
    Acyl chain
    Lipids


    1640-1700
    Amide I
    Protein


    1670-1690
    C=0 stretching [pyrimidine
    Nucleic acids


    1720-1750
    C=o    stretching in ester
    Lipids
Table 1: Raman spectra of EVs and corresponding vibrational bands [31-34].
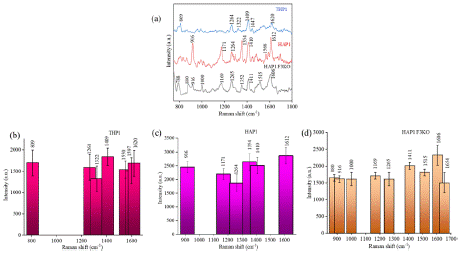
    Figure 5: (a) Raman spectra of EVs from various sources isolated in HEPES
buffer. (b-d) bar charts with the distribution of the dataset of corresponding
Raman shifts for 15 independent measurements. The standard deviation in
intensity value is shown for each Raman shift.
A closer comparison of three EVs revealed that the THP1-derived EVs do not show any distinct peak in the 1100-1200 cm-1 region dedicated to proteins and carotenoids. Further, the SERS spectra revealed that the peaks of THP1 EVs mainly occur due to functional groups of lipids and proteins. The shift at 1000 cm-1 for HAPF3KO is distinct and occurs due to protein structure. HAP and HAPF3KO show similar spectral features, indicating that their membrane composition is similar. Although there are similarities, HAP EVs show an enhanced peak at 916 cm-1, 1354 cm-1, 1566 cm-1, and 1580 cm-1, showing additional peaks of proteins and nucleic acids, which can be related to the state of the cells (viability, passage, proliferation etc). The sharp peaks at 1354 cm-1, and 1612 cm-1 for HAP1-isolated EVs are shifted to 1352 cm-1 and 1606 cm-1, respectively, with a decreased intensity for HAP1-F3KO derived EVs. Further, a clear distinction of spectral pattern for these two EVs in the region (1500–1600 cm-1), where the protein peak at 1566 cm-1 and the peak due to the nucleic acid at 1580 cm-1 in HAP1 isolated EVs are not present in the HAP1 F3KO derived EVs.
Of note, although HAP1 and HAP1-F3KO cell lines are similar, the cells were cultured separately and the differences that are shown here between EVs from the two different lines may reflect the differences between the situation of cells. Although the SERS intensity count was modest due to its suspension state, the spectra of EVs displayed additional vibrational peaks of a heterogeneous structure.
Conclusions
The proposed SERS methodology enabled the identification of EVs from diverse cell lines. The simulation results for an Ag coated curved PDMS model showed plasmonic enhancement due to its geometry. Instead of the non-uniform distribution of nanoparticles provided by sputtering as in the experimental samples, a continuous Ag film was adopted in the simulation model for complexity reasons. Therefore, we expect more anisotropy and corresponding enhancement in the local filed for the actual geometry. The SERS intensity of EVs exhibit enhanced signal with a significant variation (~10 %) in intensity among different EV measurements. This could impact the reliability and diagnostic utility of the SERS-based EV detection method. Based on previous results of this technology with other bionanoparticles, the major reason for the signal variability is attributed to the heterogeneous nature of EVs itself. The size, composition and orientation of EVs will affect the signal reproducibility. Future studies should provide more statistics for interpretation, where image analysis should assist towards accurate interpretation within the range of the variation in the spectra.
The drying of EVs samples on the proposed nano-bowl substrate can further enhance the SERS enhancement. However, drying could lead to the alteration of the membrane morphology which could show false spectral peaks [15]. Since the electro-negative surface of EVs repels the negatively charged metal layer, it is challenging for EVs to adhere or come very close to the negatively charged metals substrate. As SERS is pre-dominantly a near-field enhancement (Figure 3b), the enhancement reduces with the increasing distance between the EVs and the substrate. In future work surface modification will be explored to increase the adhesion of EVs inside the trap.
Additionally, the selectivity of the SERS measurements for different EVs can be performed by functionalizing the SERS substrate with antibody-specific surface functionalization. This investigation aims to develop a proof-of-concept method to provide valuable details about the membrane morphology and differentiation of EV subtypes without additional chemical reactions or multiple characterization steps. In the future, this platform will be tested to characterize EVs for actual human samples.
Highlight
• This manuscript reports a facile method of fabrication of susceptible, cost-effective, and honeycomb like nano-bowl SERS film using a monolayer Polystyrene (PS) beads template.
• The fabrication technique is simple, low-cost, and acceptable for mass production.
• The fabricated SERS substrate is optimised, and a 3D FDTD simulation investigates the enhancement mechanism.
• The unique nano-bowl film morphology exhibits high surface barriers that could provide potential trap-sites for bionanocarriers to enable in-focal measurements in suspension.
• The low-cost reusable SERS substrate is sensitive to detecting Extracellular Vesicles (EVs) derived from three different malignant leukemia cells (HAP1, HAP1-F3KO, and THP1) to explore molecular signatures of EVs and the associated cell of origin.
Author Statements
Acknowledgments
S. Das acknowledges the Prime minister research fellowship (PMRF), Govt. of India and Research Council of Norway funded INTPART grant nanoSymBioSys (id. 309802). S. Das is grateful to Prof. Matteo Chiesa, Renewable energy group, UiT Tromso for the Raman measurement facility. S. Das is thankful to Deanna L Wolfson for her support and assistance during the research.
Disclosures
The authors declare no conflicts of interest.
References
- Nelson BC, Maragh S, Ghiran IC, Jones JC, DeRose PC, ElsheikhE, et al. Measurement and standardization challenges for extracellular vesicle therapeutic delivery vectors Nanomedicine. 2020; 15: 2149–70.
- Chen P, Wang L, Fan X, Ning X, Yu B, Ou C, et al. Targeted delivery of extracellular vesicles in heart injury. Theranostics. 2021; 11: 2263–77.
- Zaborowski MP, Balaj L, Breakefield XO, Lai CP, Extracellular vesicles: Composition, biological relevance, and methods of study. BioScience. 2015; 65: 783–97.
- Wang J, Kao YC, Zhou Q, Wuethrich A, Stark MS, Schaider H, et al. An integrated microfluidic‐sers platform enables sensitive phenotyping of serum extracellular vesicles in early stage melanomas. Advanced Functional Materials. 2021; 32.
- Goetz LH, Schork NJ. Personalized medicine: Motivation, challenges, and progress. Fertility and Sterility. 2018; 109: 952–6.
- Shao B, Xiao Z. Recent achievements in exosomal biomarkers detection by nanomaterials-based optical biosensors - A Review. Analytica Chimica Acta. 2020; 1114: 74–84.
- Liu G, Wei J, Li X, Tian M, Wang Z, Shen C, et al. Near‐infrared‐responded high sensitivity nanoprobe for steady and visualized detection of albumin in hepatic organoids and mouse liver. Advanced Science. 2022; 9: 26.
- Xu S, Wang T, Liu G, Cao Z, Frank LA, Jiang S, et al. Analysis of interactions between proteins and small-molecule drugs by a biosensor based on a graphene field-effect transistor. Sensors and Actuators B: Chemical. 2021; 326: 128991.
- Pilot R, Signorini R, Durante C, Orian L, Bhamidipati M, Fabris L. A Review on Surface-Enhanced Raman Scattering. Biosensors. 2019; 9: 57.
- Das S, Goswami LP, Gayathri J, Tiwari S, Saxena K, Mehta DS. Fabrication of low cost highly structured silver capped aluminium nanorods as SERS substrate for the detection of biological pathogens. Nanotechnology. 2021; 32: 495301.
- Lu J, Zhang D, Chen Q, Shang Z, Huang J, Liang P. Nanoparticles/parabolic Nano-bowl hybrid structure as a surface-enhanced Raman scattering substrate: Insights using the FDTD method. The Journal of Physical Chemistry C. 2022; 126 14211–8.
- Mosier-Boss PA, Review of SERS Substrates for Chemical Sensing. Nanomaterials. 2017; 7: 142.
- Das S, Saxena K, Tinguely JC, Pal A, Wickramasinghe NL, Khezri A, et al. SERS nanowire chip and machine learning-enabled classification of wild-type and antibiotic-resistant bacteria at species and strain levels. ACS Applied Materials & Interfaces. 2023; 15: 24047–58.
- Li C, Man B, Zhang C, Yu J, Liu G, Tian M, et al. Strong plasmon resonance coupling in micro-extraction SERS membrane for in situ detection of Molecular Aqueous Solutions. Sensors and Actuators B Chemical. 2024; 398: 134767.
- Wang J, Kao YC, Zhou Q, Wuethrich A, Stark MS, Schaider H, et al. An integrated microfluidic‐sers platform enables sensitive phenotyping of serum extracellular vesicles in early-stage melanomas. Advanced Functional Materials. 2021; 32.
- Yan Z, Dutta S, Liu Z, Yu X, Mesgarzadeh N, Ji F, et al. A label-free platform for identification of exosomes from different sources. ACS Sensors. 2019; 4: 488–97.
- Yao W, Kim CIL. Correction to: A lipid membrane morphology subjected to intra-membrane viscosity and membrane thickness dilation Continuum Mechanics and Thermodynamics. 2023.
- Zong C, Xu M, Xu LJ, Wei T, Ma X, Zheng XS, et al. Surface-enhanced Raman spectroscopy for bioanalysis: Reliability and challenges. Chemical Reviews. 2018; 118: 4946–80.
- Ertsgaard CT, Wittenberg NJ, Klemme DJ, Barik A, Shih WC, Oh SH. Integrated nanogap platform for sub-volt dielectrophoretic trapping and realtime Raman imaging of biological nanoparticles. Nano Letters. 2018; 18: 5946–53.
- Kaufman L, Cooper TT, Wallace GQ, Hawke DC, Betts D, Hess D, et al. Trapping and SERS identification of extracellular vesicles using nanohole arrays. Plasmonics in Biology and Medicine XVI. 2019.
- Yuan Y, Lin Y, Gu B, Panwar N, Tjin SC, Song J, et al. Optical trappingassisted SERS platform for chemical and Biosensing Applications: Design perspectives. Coordination Chemistry Reviews. 2017; 339: 138–52.
- Ren Y, Chen Q, He M, Zhang X, Qi H, Yan Y. Plasmonic Optical Tweezers for particle manipulation: Principles, methods, and applications. ACS Nano. 2021; 15: 6105–28.
- Liu W, Li Y, Li Z, Du X, Xie S, Liu C, et al. 3D flexible compositing resonant cavity system for high-performance SERS sensing. Optics Express. 2023; 31: 6925.
- Das S, Tinguely JC, Obuobi SAO, Škalko-Basnet N, Saxena K, Ahluwalia BS, et al. Plasmonic Nano-bowls for monitoring intra-membrane changes in liposomes, and DNA-based nanocarriers in suspension. Biomedical Optics Express. 2024; 15: 229.
- Shah PT, Tufail M, Wu C, Xing L. THP-1 cell line model for tuberculosis: A platform for in vitro macrophage manipulation. Tuberculosis. 2022; 136: 102243.
- Østerud B, Latysheva N, Schoergenhofer C, Jilma B, Hansen JB, Snir O. A rapid, sensitive, and specific assay to measure TF activity based on chromogenic determination of thrombin generation. Journal of Thrombosis and Haemostasis. 2022; 20: 866–76.
- Das S, Tinguely JC, Kundu V, Saxena K, Ahluwalia BS, Mehta DS. Sculptured silicon nanopillars bridging face to face nanogaps with metal-insulator-metal coating for surface enhanced Raman spectroscopy. Surfaces and Interfaces. 2024; 44: 103836.
- Mao P, Liu C, Favraud G, Chen Q, Han M, Fratalocchi A, et al. Broadband single molecule SERS detection designed by Warped Optical Spaces. Nature Communications. 2018; 9.
- Liu CS, Tripathi V K. Optical gain in surface plasmon nanocavity oscillators. Journal of Nanophotonics. 2016; 10: 016015.
- Chalapathi D, Padmanabhan S, Manjithaya R, Narayana C. Surfaceenhanced Raman spectroscopy as a tool for distinguishing extracellular vesicles under autophagic conditions: A marker for disease diagnostics. The Journal of Physical Chemistry B. 2020: 124; 10952–60.
- Yaraki MT, Tukova A, Wang Y. Emerging Sers biosensors for the analysis of cells and extracellular vesicles. Nanoscale. 2022; 14: 15242–68.
- Cals FLJ, Bakker Schut TC, Hardillo JA, Baatenburg de Jong RJ, Koljenović S, Puppels GJ. Investigation of the potential of Raman spectroscopy for oral cancer detection in surgical margins. Laboratory Investigation. 2015; 95: 1186–96.
- Tatischeff I, Larquet E, Falcón-Pérez JM, Turpin PY, Kruglik SG. Fast characterisation of cell-derived extracellular vesicles by nanoparticles tracking analysis, Cryo-electron microscopy, and Raman tweezers microspectroscopy. Journal of Extracellular Vesicles. 2012: 1.
- Zhang H, Silva AC, Zhang W, Rutigliano H, Zhou A. Raman spectroscopy characterization extracellular vesicles from bovine placenta and peripheral blood mononuclear cells. PLOS ONE. 2020; 15.