
Editorial
The Red Blood Cells (RBCs) are acquainted as erythrocytes. The normal size of RBCs usually lies between 80 and 100fL. Practically, Red Cell Index (RCI) is a blood trail, which provides information about the hemoglobin content & Red Blood Size (RBS) Mean Corpuscular Volume (MCV), while MCV explains the average Red Blood Cell Size (RBCS), which is calculated by dividing the Hematocrit (HCT) by the red cell count [1-4]. Many research articles have reported as effective predictors of cardiac disease treating, RCI associated with HCT & MCV, Blood Plasma Volume (BPV), and White Blood Cells (WBC), along with its subtypes such as lymphocytes, monocytes, and neutrophils [1,4-6]. The following queries are examined in the current report.
• Is there any association of RCI with some cardiac factors for shock patients?
• If it is affirmative, what are the associations?
• What are the effects of RCI on cardiac factors?
These queries are studied in the report with the help of a real data set of 113 shock patients containing 20 characters, which is given in: https://www.umass.edu/statdata/statdata/data/shock.txt and the patient population and data collection method are well described in [7]. For ready reference, the 20 study characters are reported as follows.
• Age,
• Sex (male=0, female=1),
• Height,
• Systolic Blood Pressure (SBP),
• Shock Type (Shock) (non-shock=1, hypovolemic=2, cardiogenic, or bacterial, or neurogenic or other=3),
• Diastolic Blood Pressure (DBP),
• Survival Status (SURVIV) (survived=1, death=2),
• Heart Rate (HR),
• Hematocrit (HCT),
• Hemoglobin (HG),
• Plasma Volume Index (PVI),
• Cardiac Index (CI),
• Appearance Time (AT),
• Mean Arterial Pressure (MAP),
• Urinary Output (UO),
• Mean Central Venous Pressure (MCVP),
• Mean Circulation Time (MCT),
• RCI,
• Body Surface Index (BSI),
• Card Record Order (initial=1, final=2) (CRO).
The above data set contains seven cardiac factors such as DBP, SBP, MAP, HR, MCVP, CI and shock type. The above queries should be examined in two ways such as modeling of a cardiac factor on RCI, along with the remaining others, and also modeling of RCI on all the cardiac factors, along with the remaining others. Note that DBP, SBP, MAP, HR, MCVP, CI are all continuous variables, while shock type is an attribute character.
Let us examine the RCI modeling on all the cardiac factors, along with the remaining other variables. Here all the continuous variables are positive, heterogeneous, continuous and non-normally distributed. These are modeled using Joint Generalized Linear Models (JGLMs) under both the Log-normal & Gamma distributions [8- 10]. Log-normal JGLMs fit of RCI is better than the Gamma, which is shown in Table 1, and its fit verification is displayed in Figure 1. Figure 1(a) shows the absolute residuals plot against the predicted RCI values, which is approximately a flat straight line, concluding that variance is constant with the running means. On the hand, Figure 1(b) shows the normal probability plot of mean RCI Lognormal fitted model in Table 1. Both the plots do not reveal any fit discrepancy. Therefore, Log-normal fitted RCI model (Table 1) is approximately a very close to its true model. RCI mean & dispersion models are as follows.
![]()
    Model
    Covariate
    Estimate
    Standard error
    t-value
    P-Value


      Mean


    Constant
    2.0914
    0.205171
    10.193
    <0.0001


    Age
    0.0011
    0.000922
    1.1861
    0.2369


    Shock2
    -0.0689
    0.035321
    -1.9522
    0.0522


    Shock3
    -0.0156
    0.039741
    -0.3942
    0.6939


    BSI
    -0.1877
    0.085501
    -2.1962
    0.0291


    PVI
    0.0066
    0.001142
    5.7462
    <0.0001


    HG
    0.0325
    0.012541
    2.5882
    0.0103


    HCT
    0.0148
    0.004161
    3.5613
    0.0004


      Dispersion


    Constant
    3.724
    2.11931
    1.7571
    0.0804


    Height
    -0.0282
    0.01262
    -2.2403
    0.0261


    Shock2
    -0.1284
    0.29661
    -0.4332
    0.6654


    Shock3
    0.5488
    0.31011
    1.7691
    0.0783


    SBP
    0.0051
    0.00371
    1.3581
    0.1758


    CI
    -0.1796
    0.08682
    -2.0692
    0.0397


    UO
    -0.0014
    0.00092
    -1.5601
    0.1202


    PVI
    -0.014
    0.00812
    -1.7303
    0.085


    HCT
    -0.0398
    0.01492
    -2.6612
    0.0083
Table 1: Results for mean and dispersion models of RCI from Log-normal fit.
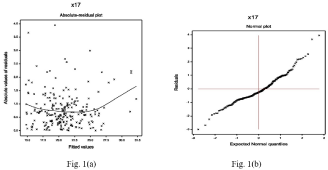
    Figure 1: For the RCI fitted Log-normal fitted models (Table 1) the (a) absolute residuals plot with respect fitted values, and (b) normal probability plot for the mean
model.
Mean = =Log(RCI) = 2.0914 + 0.0011Age - 0.0689Shock2 - 0.0156 Shock3 - 0.1877BSI + 0.0066PVI + 0.0325HG + 0.0148HCT, and
Dispersion = = exp(3.7240 - 0.0282Height - 0.1284Shock2 + 0.5488Shock3 + 0.0051SBP -0.1796CI - 0.0014UO - 0.0140PVI - 0.0398HCT).
From Table 1, and the above mean & dispersion models, the following associations of RCI with cardiac factors can be intimated.
• Mean RCI level is inversely associated with shock type at level Shock2 (P=0.0522), indicating that as RCI level decreases, incidence of shock will be increased of the shock patients at level Shock2 than the non-shock patients at level Shock1.
• Variance of RCI level is inversely associated with CI (P=0.0397), concluding that it increases as CI decreases.
• RCI level variance is directly associated with shock type at level Shock3 (P=0.0783), indicating that it increases for the shock patients at higher level shock3, than the other patients.
• RCI level variance is directly partially associated with SBI (P=0.1758), interpreting that it increases as SBI increases. Note that in epidemiology, partially significant effect is treated as confounder in the model.
The above associations of RCI level with cardiac factors (shock type, CI & SBP) are derived from its mean and variance models.
On the other hand, the associations of a cardiac factor (such as MCVP, MAP, HR, SBP, DBP and CI) with RCI level can be examined from its respective JGLMs. From the JGLMs of MCVP, MAP and HR, which are given in [11-13], the following associations, can be concluded.
• MCVP is directly partially associated with RCI (P=0.3155), interpreting that MCVP rises as RCI increases [11]. Here RCI is a confounder.
• Variance of MCVP level is inversely associated with RCI (P=0.0183), concluding that it increases as RCI decreases [11].
• MAP is inversely associated with RCI (P=0.0610), implying that it increases as RCI decreases [12].
• Variance of heart rate is directly associated with RCI (P=0.0509), indicating that that it increases as RCI increases [13].
The summarized form of the above associations of RCI is displayed in Table 2. JGLMs of SBP, DBP, CI do not show any association with RCI [14,15].
![]()
    Model
    Response Variable
    Associated with
    Estimate
    S.E.
    t-value
    P-value


    Mean
    MCVP
    RCI
    0.0020
    0.0020
    1.010
    0.3155


    Variance
    MCVP
    RCI
    -0.0340
    0.0143
    -2.377
    0.0183


    Mean
    MAP
    RCI
    -0.0008
    0.0004
    -1.883
    0.0610


    Variance
    HR
    RCI
    0.0420
    0.0216
    1.963
    0.0509
Table 2: Association of Cardiac factors (MCVP, MAP, HR) with RCI.
The report has focused the associations of RCI level with many cardiac factors such as shock-type, CI, MCVP, MAP, HR and SBP. Any association of RCI with DBP is not shown in the report. Further studies may give more information. It is found herein that RCI is associated with shock type. Its low level invites shock (Table 1). The reasons of shock and variation of other cardiac factors such as CI, MCVP, MAP, HR and SBP can be explained with the predictor RCI level. Researchers and medical practitioners can be benefitted from the report. Shock patients should care on the RCI level regularly.
Acknowledgement
This research was supported by the National Research Foundation of Korea (NRF) grant funded by the Korea government (MSIT) (No. 2019R1A2C1002408).
References
- Arbel Y, Weitzman D, Raz R, Steinvil A, Zeltser D, Berliner S, et al. Red blood cell distribution width and the risk of cardiovascular morbidity and all-cause mortality: A population based study. Thromb. Haemost. 2014; 111: 300-307.
- Puddu PE, Lanti M, Menotti A, Mancini M, Zanchetti A, Cirillo Met al. Red blood cell count in short-term prediction of cardiovascular disease incidence in the Gubbio population study. ActaCardiol. 2002; 57: 177-185.
- Lippi G, Plebani M. Red Blood Cell Distribution Width (RDW) and human pathology: One size fits all. Clin Chem Lab Med. 2014; 52: 1247-1249.
- Salvagno GL, Sanchis-Gomar F, Picanza A, Lippi G. Red blood cell distribution width: A simple parameter with multiple clinical applications. Crit Rev Clin Lab Sci. 2015; 52: 86-105.
- Mozos I. Mechanisms Linking Red Blood Cell Disorders and Cardiovascular Diseases. BioMed Research International. Volume. 2015; 1-12.
- Libby P. Inflammation in atherosclerosis. Nature. 2002; 420: 868-874.
- Afifi AA, Azen SP. Statistical analysis: A computer oriented approach. 2nd edition. Academic Press, New York. 1979.
- Lee Y, Nelder JA, PawitanY. Generalized Linear Models with Random Effects (Unified Analysis via H-likelihood) (second edition). Chapman & Hall. London. 2017.
- Das RN, Lee Y. Log-normal versus gamma models for analyzing data from quality-improvement experiments. Quality Engineering. 2009; 21: 79-87.
- Lesperance ML, Park S. GLMs for the analysis of robust designs with dynamic characteristics. Jour. Qual. Tech. 2003; 35: 253-263.
- Das RN, Lee Y, Oh S. The Determinants of Mean Central Venous Pressure for Shock Patients. J Clin Trial Cardiol. 2018; 5: 1-5.
- Das RN. The mean arterial blood pressure determinants. EC Cardiology. 2017; 4: 14-16.
- Das RN. Shock patients heart rate variability factors. Journal of Cardiovascular Medicine and Therapeutics. 2017; 1: 19-23.
- Das RN. Systolic & Diastolic Blood Pressure Determinants of Shock Patients. J Heart Cardiol. 2017; 3: 46- 52.
- Kim J, Das RN, Lee Y. Cardiac Index Predicted Factors for Shock Patients. World Scientific News. 2019; 119; 181-191.