
Research Article
Ann Agric Crop Sci. 2024; 9(6): 1171.
Assessment of Metal Pollution Index (MPI) in Selected Rice Brands
Jamila M Machano; Abdul AJ Mohamed*
Department of Natural Science, School of Natural and Social Sciences, the State University of Zanzibar. P. O. Box 146, Zanzibar – Tanzania
*Corresponding author: Abdul AJ Mohamed, Department of Natural Science, School of Natural and Social Sciences, the State University of Zanzibar. P. O. Box 146, Zanzibar – Tanzania. Email: jumabdull@yahoo.com
Received: November 04, 2024; Accepted: November 22, 2024; Published: November 29, 2024
Abstract
Background: This study aims at assessing the level of metal pollution index in different rice brands. While the metals involved in this assessment are K, Mg, Cu, Fe, Mn and Zn, the rice brands are Basmati, Jasmine, Shinyanga, Mbeya, Morogoro, Mapembe and Cheju.1
Method: Samples were prepared in accordance with applicable Standard Operating Procedures (SOPs) and laboratory SOPs using information provided by field sample preparation. The samples were grinded to fineness and an aliquot of about 10.0 g was measured on the beam balance and mounted on the sample holders for laboratory analysis. An Energy Dispersive X-Ray Fluorescence (EDXRF) technique with a Rigaku NEX CG EDXRF model spectrometer was used to quantify the level of analyzed metals.
Results: The data analysis reveals the remarkable highest concentrations for potassium and magnesium in all analyzed rice brands, their values were 1700 mg/Kg and 1000 mg/Kg respectively. On the other hand, all rice brands contained low concentrations of copper. Additionally, the Metal Pollution Index (abbreviated as P) intended to show the degree of contamination for the analyzed metals in all rice brands was also assessed. Importantly, there is an existence of strong correlation in P levels (R2 = 0.98) for analyzed metals in the local rice brands cultivated from Shinyanga and Mbeya regions in Tanzania. Similar observation on correlationship of P levels for the same metals was observed between Jasmine rice brand and Mapembe rice brand (R2 = 0.99). The sound reasons for this remarkable trend could be but not limited to a common agricultural practices involving similar fertilizer applications, spray of pesticides and herbicides, the background concentration of the metals in irrigation water could have a significant impact as well. Moreover, the P level for K and Cu metal in all rice brands was less than 1, indicating low degree of contamination. Nevertheless, for the case of Fe, the degree of contamination was also low in all rice brands except for the Jasmine rice (P = 2.62). P level for Mg in five rice brands shows a moderate degree of contamination (1 = P < 3) with exception of Mbeya and Cheju rice. For the case of Mn and Zn, all rice brands show highest contamination level (P > 3).
Conclusion: With respect to the analyzed metals and their respective P values, it is very clear that, the trend for the metal contamination in all rice brands depicts the following trend: Jasmine > Mbeya > Mapembe > Shinyanga > Cheju > Morogoro > Basmati. However, it is very apparent that, it is not easy to draw a general irrefutable statement with regard to the safety of the analyzed rice brands. Hence, the study recommends intensive analysis of the imported rice and proper cultivation methods specifically in soil and agrochemicals analysis before utilization.
Keywords: Jasmine; Cheju; Manganese; Zinc; Irrefutable statement; MPI
Introduction
Rice is one among the nutritious food that contains nutritive vitamins, 20% proteins, 3 % fat and provides 27% nutritive energy as well [2,3], although it is more susceptible for heavy metal contamination than other crops [8].
Heavy metal contamination in rice might be caused by various factors including agrochemicals used such as chemical fertilizer, pesticides and herbicides, inappropriate burning of waste materials, water for irrigation, and exhaust of vehicles [11].
Some metals including Cu, Fe, Mn and Zn are considered as micronutrients and they are useful in human body although they should be taken in small concentration, if they exceed the permissible limit, they become toxic and hence lead several acute and chronic effects [12]. These metals have the tendency of changing their form and remain in human body for extended period of time [10]. Heavy metals are carcinogenic in nature and are suspected for several diseases including bone, blood, kidney and heart damage [7].
Assessment of the level of metal contamination is given as Metal Pollution Index (abbreviated as P) in all samples has been used in this study to distinguish the dominated metal while estimating the pollution status in analyzed rice brands. This was done through calculation expressed by the formula;
P = C/MAC
C is the concentration of specific metal in sample,
MAC is the maximum permissible level of metal
Values of Metal Pollution Index obtained after formula manipulation can be categorized in three main stages (Alberto Then et al., 2023), these stages are as follows:
i. P < 1: Indicates Low Pollution Level
ii. 1 = P < 3 : Indicates Moderate Pollution Level
iii. P > 3 : Indicates Highest Pollution Level
Materials and Methods
Sample Collection and Analysis
About 18 varieties of rice samples were collected from seven common rice brands namely; Basmati, Jasmine, Mbeya, Morogoro, Shinyanga, Mapembe and Cheju). 1.0 kilogram each, were randomly collected from Darajani and Mwanakwerekwe markets. Basmati, Jasmine, and Mapembe were obtained from Darajani market and Shinyanga, Mbeya, and Morogoro were collected from Mwanakwerekwe market. Cheju rice was collected from Cheju district. Samples were separately stored in polyethylene bags before being sent to SEAMIC, Kunduchi – Dar – es - salaam for metal analysis.
An Energy Dispersive X-Ray Fluorescence (EDXRF) Spectrometer was used for sample analysis. This instrument is able to undergo elemental analysis in solid, liquid and powder samples. X-rays strike the sample and cause the atoms in the sample to fluoresce their own characteristic low energy “soft” X-rays. These fluorescent X-rays are then brought in a detector and counted by a multi-channel analyzer. Finally, the NEX CG software calculates the elemental concentration from Sodium to Uranium for all the detected elements in a given sample.
Results and Discussion
Table 1 shows the minimum and maximum concentrations of analyzed metals in seven brands of rice. In all rice brands, K was detected at highest concentration, it ranged between 1100 to 1700 mg/ Kg. Meanwhile, Cheju rice was found to contain the highest level of Mg (1100 mg/Kg). Besides, Jasmine rice had highest concentration of Cu, Fe, Mn and Zn, their levels were 9.86, 51.4, 21.9 and 30.8 mg/Kg respectively.

Table 1: Min. and Max. Concentrations of analyzed Elements in Rice Samples.
Data from Table 2 gives the description that, the concentration of K in this study and previous studies is within WHO/FAO Maximum Permissible Levels. Other metals including Cu, Fe, Mn and Zn were above the Maximum Permissible Level set by WHO/FAO standards.
Elements
This study
Other Studies
WHO/ FAO Std.
Zanzibar
(Cheju)Tanzania mainland
Imported
Ethiopia (Tegegne et al., 2017)
United States (TatahMentan et al., 2020)
Tanzania
(Mohammed., 2008)K
1700
1700
1400
1100
2252
1068
3500
Mg
1100
1000
800
99.5
1110
509
310
Cu
8.8
6.77
9.86
15.0
5.2
3.0
0.50
Fe
19.7
18.8
51.4
108
11
25.0
19.60
Mn
16.4
21.6
21.9
3.7
27.0
13.0
0.50
Zn
23.3
22.2
30.8
51.6
19.0
29.0
1.0
Table 2: Elemental Comparison of Present Study with Previous Studies.
Mbeya and Cheju showed highest levels of K (1700 mg/Kg), which is still safe with respect to Maximum Permissible Limit set by FAO/ WHO. Meanwhile, in all rice brands, Mg concentration was found to exceed the WHO/FAO Maximum Permissible Limit, Cheju rice being the leading brand (Figure 1).
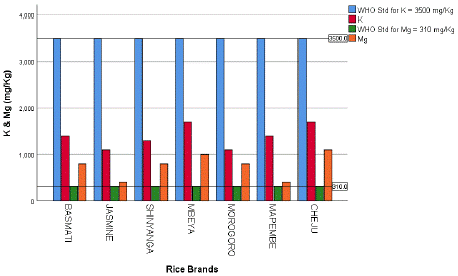
Figure 1: K and Mg Concentration in Rice Brands.
Zinc metal was highly concentrated in all rice brands and its concentration was beyond WHO/FAO maximum permissible limit, but Jasmine rice specifically was the most leading brand. In terms of iron metal, only Jasmine rice was beyond the maximum permissible limit set by WHO/FAO, other brands were within the Maximum Permissible Limit (Figure 2).
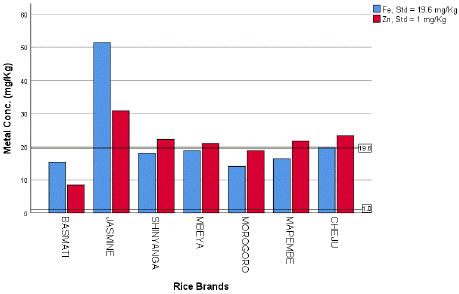
Figure 2: Fe and Zn Concentration in Rice Brands.
Pollution Index Assessment (P)
This parameter P, determines the degree of metal contamination in rice samples as depicted in Table 3.
    MPI
    K
    Mg
    Cu
    Fe
    Mn
    Zn


    BASMATI
    0.40
    2.58
    0.53
    0.78
    14.44
    8.42


    JASMINE
    0.31
    1.29
    0.99
    2.62
    43.80
    30.80


    SHINYANGA
    0.37
    2.58
    0.68
    0.92
    35.20
    22.20


    MBEYA
    0.49
    3.23
    0.64
    0.96
    43.20
    21.00


    MOROGORO
    0.31
    2.58
    0.53
    0.72
    32.60
    18.80


    MAPEMBE
    0.40
    1.29
    0.68
    0.84
    37.60
    21.70


    CHEJU
    0.49
    3.55
    0.88
    1.01
    32.80
    23.30
Table 3: MPI in Rice Brands.
Both Table 3 and Figure 3 a & b show the P level for potassium and copper in all analyzed samples to be less than 1. The same results was noted for Fe (except in Jasmine rice, P = 2.62) indicating that these rice brands with respect to these analyzed metals are safer for human consumption. Furthermore, the P level for Mg in five rice brands with exception of Mbeya and Cheju rice displays a moderate degree of contamination (1 = P < 3). Extraordinarily, there was highest contamination for Mn and Zn (P > 3) in all analyzed rice brands, indicating that there is great possibility for acute and chronic effects to the rice consumers. Hence, there is difficulty in making general statement with regard to the safety of the analyzed rice brands.
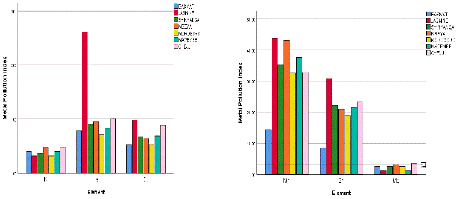
Figure 3: a) P-Level for K, Fe and Cu, b) P-Level for Mn, Zn and Mg.
Correlationship of MPI on Rice Brands with respect to Regions
Figure 4a indicates a strong correlation (R2 = 0.98) in P values of analyzed metals between rice brand cultivated in Shinyanga and that of Mbeya. As noted earlier for the MPI correlation between Shinyanga and Mbeya rice, similar observation (Figure 4b) for Jasmine rice brand and Mapembe rice brand, the strong correlation in P values for these metals in imported rice was also noted (R2 = 0.99). The sound reasons for these remarkable trends could be but not limited to a common agricultural practices involving similar fertilizer applications, spray of pesticides and herbicides, the background concentration of the metals in irrigation water also could have a significant impact on quality of harvested rice.
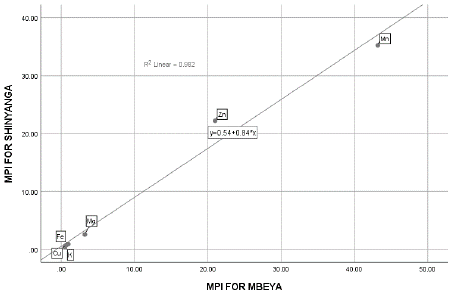
Figure 4a: MPI Correlation between Shinyanga and Mbeya Rice.
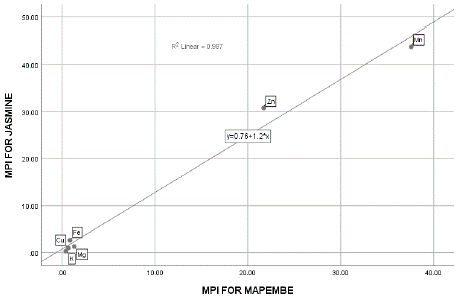
Figure 4b: MPI Correlation between Jasmine and Mapembe Rice.
Conclusion
The results of this study revealed the presence of highest concentration of Cu, Fe, Mn and Zn in Jasmine rice. This can be generalized by the statement that, Jasmine rice has highest levels of analyzed metals compared to other rice brands. Nevertheless, the consumption of foodstuff containing metal could be considered as a silence killer. This concern has to be precaustiously considered by agricultural experts in order to ensure that the concentrations of chemicals in rice and other foodstuff are in safe limit for the consumer’s health and the environment in general. Comprehensive analysis of foodstuff as well as agricultural soil in which the food are grown should also be routinely done, so as to ensure that people consume safe and healthy foods.
References
- Alberto Then NM, Delanoy R, Rodriguez Alberto D, Mendez Henandez R, Diaz Rizo O, Bello L. Heavy Metal Pollution assessment in Agricultural Soils of Bunao, Dominican Republic. Sustainability. 2023; 15: 16510.
- Fresco L. Rice is life. J Food Compos Anal. 2005; 18: 249-253.
- Kennedy G, Burlingame B, Nguyen VN. Nutrition contribution of rice and impacts of biotechnology and biodiversity in rice consuming countries. In proceedings of 20th Session of the International Rice Commission, Bangkok, Thailand. 2003.
- Mohammed NK. Nuclear Techniques Applied to Biological Samples from Tanzania to Monitor the Nutritional Status of Children. Faculty of Engineering and Physical Sciences. University of Surrey. 2008.
- Tatah Mentan M, Nyachoti S, Scott L, Phan N, Okwori FO, Felemban N, et al. Toxic and essential elements in rice and other grains from the United States and other countries. Int J Environ Res Public Health. 2020; 17: 8128.
- Tegegne B, Chandravanshi BS, Zewge F. Levels of selected metals in commercially available rice in Ethiopia. International Food Research Journal. 2017; 24: 711-719.
- Ugulu I, Khan ZI, Sheik Z, Ahmad K, Bashir H, Ashfaq A. Effects of wastewater irrigation as an alternative irrigation resource on heavy metal accumulation in ginger (Zingiber officinale Rocs.) and human health risk from consumption. Arab J Geosci. 2021; 14: 702.
- Wei R, Chen C, Kou M, Liu Z, Wang Z, Cai J, et al. Heavy metal concentrations in rice that meet safety standards can still pose a risk to human health. Communications earth & environment. 2023; 4: 723-727.
- www.bfr.bund.de (accessed on 03rd September, 2024).
- Yap DW, Adezrian J, Khairiah J, Ismail BS, Ahmad-Mahir R. The uptake of heavy metals by paddy plants (Oryza sativa) in Kota Marudu, Sabah, Malaysia. Am Eurasian J Agric Environ Sci. 2009; 6: 16.
- Zaheer IE, Ali S, Saleem MH, Ali M, Riaz M, Javed S, et al. Interactive role of zinc and iron lysine on Spinacia oleracea L. growth, photosynthesis and antioxidant capacity irrigated with tannery wastewater. Physiol. Mol. Biol. Plants. 2020a; 26: 2435-2452.
- Zaheer IE, Ali S, Saleem MH, Ali Q, Arslan Ashraf M, Alyemeni MN, et al. Zinc-lysine Supplementation Mitigates Oxidative Stress in Rapeseed (Brassica napus L.) by Preventing Phytotoxicity of Chromium, When Irrigated with Tannery Wastewater. Plant. 2020b; 9: 1145.