
Research Article
Ann Agric Crop Sci. 2025; 10(1): 1178.
Performance Evaluation of Small white common bean (Phaseolus vulgaris L.) Varieties at Buno Bedele and Ilu Aba Bora Zones, South-western Oromia
Mohammed Tesiso* and Garoma Firdisa
Oromia Agricultural Research Institute, Bedele Agricultural Research Center, Bedele, Ethiopia
*Corresponding author: Mohammed Tesiso, Oromia Agricultural Research Institute, Bedele Agricultural Research Center, Bedele, Ethiopia Email: mohatesiso@gmail.com
Received: April 09, 2025 Accepted: April 21, 2025 Published: April 25, 2025
Abstract
The field experiment was conducted at two districts of Buno Bedele zone (Bedele & Dabo Hana) and one district of Ilu Aba Bor zone (Bure) in southwestern Oromia for two years (2023-2024 G.C). The objective of this study was to select adaptable, stable, higher yield and disease resistant small white common bean varieties. In the experiment, six improved small white common bean varieties and one local check were laid out in randomized complete block design (RCBD) with three replications. Phenological, growth, yield and yield related traits data were collected and analyzed by R-software. Grain yield and yield related traits were significantly affected by main effect of variety, environment and variety-environment interaction. The results revealed that, there were significant at (p < 0.001) variations between the varieties for yield, number seed per pod and days to maturity whereas significant at (p<0.01) for days to flowering, plant height and number of pod per plant. Thus, higher grain yield was recorded from Awash mitin (2330.51 kgha-1) followed by Wabero (1878.11 kgha-1), while lower grain yield was recorded from Awash-1 (1261.36 kgha-1). The AMMI analysis shown that 14.92% of the total sum of squares (SS) was contributed to environments (E), 25.76% to the genotypes (G) and 23.08% to GEI effects. Principal component 1 and 2 accounted for 73.80% and 15.01% of the GEI respectively with a total of 88.81% variation. Therefore, as compared to the others, those two small white common bean varieties were recommended as promising varieties to the farmers of study areas.
Keywords: Small white common bean; Grain yield; Varieties; RCBD and AMMI
Introduction
Common bean (Phaseolus vulgaris L; 2n= 22) is a diploid selfpollinated plant that goes to the genus Phaseolus in the Fabaceae family [1], which has more than 80 cultivated and wild species in the world [2]. Common bean is the most vital food and cash crops worldwide [3]. Common bean is very favored by Ethiopian farmers because of the possibility of maturing by around two months that enables households to get cash returns vital to pay for food and other household needs when other crops have not yet matured [4]. Early maturity and moderate degree of drought tolerance led the crop’s vital role in farmers’ strategies for risk aversion in drought prone lowland areas of the country [5].
In Africa, the major common bean producing countries include Burundi, DR Congo, Ethiopia, Kenya, Rwanda, Tanzania and Uganda, indicating that East Africa is the most suitable bean production region on the continent [6,7]. Common bean is the most broadly cultivated in Ethiopia which covered 18.6% of land with 17.3% of grain production from pulse crops produced in 2021 [8]. In Ethiopia, common bean covered about 339,350.34 hectares of land and 584,157.99 tons of grain was produced per annum in 2022 with average productivity of 1.72 tons per hectare [9]. As the demand of common bean production is increasing in alarming rate, the area of production increasing from 280,834.99 ha in 2020 to 339,350.34 ha in 2022 [9].
There are widespread kinds of common bean types grown in Ethiopia including mottled, red, white and black varieties [10]. The most profitable varieties are pure red and pure white color beans and these are fetching the most commonly grown types with increasing market demand [11]. Among zones in south-western Oromia, the production of common bean is concentrated in the lowlands of Buno Bedele and Ilu Aba Bora zones, specially Dabo Hana, Bedele and Bure districts due to the presence suitable environments to this crop. However, lack of improved varieties of small white common bean is the major problem for low production and productivity of the crop in the study areas. Therefore, the study was initiated to identify and recommend suitable high yielder and disease tolerant small white common bean varieties for the study areas and similar agro ecologies in south-western Oromia, Ethiopia.
Materials and Methods
Experimental Site
The experiment was conducted under rain fed condition at Bedele, Dabo Hana and Bure districts which are far 483 km, 521 km and 683 km from Addis Ababa respectively during 2023 and 2024 main cropping season. These locations represent the major common bean producing areas of South-western Oromia regional state (Table 1).
![]()
    Years
    Sites
    Codes of sites
    Altitude (masl)
    Latitude
    Longitude
    Annual Rf. (mm)


      2023
    Bedele
    E1
    1300-2200
    8°14'N
    36°13'E
    1200-1800


    Dabo Hana
    E3
    1190-2323
    8°43'N
    36°26'E
    900-2200


    Bure
    E5
    1530-2000
    8o18’N
    36o31’E
    1000-2000


      2024
    Bedele
    E2
    1300-2200
    8°14'N
    36°13'E
    1200-1800


    Dabo Hana
    E4
    1190-2323
    8°43'N
    36°26'E
    900-2200


    Bure
    E6
    1530-2000
    8o18’N
    36o31’E
    1000-2000
Table 1: Years, sites, codes, coordinate status of the environment long term of
precipitation.
Experimental Materials and Design
A total of six improved small white common bean varieties (Mex- 142, RAZ-42, Awash-1, Awash melka, Awash mitin and Wabero) including one local check were used as planting materials. The experiment was tested using a randomized completed block design (RCBD) with three replications. The experimental plots were 6 m2 (3m × 2m) in size, with five rows separated by 0.4m. The distance between plots and blocks was 0.5 m and 1m, respectively. Out of five rows, the middle three rows were used for data collection and the two outer most rows were used as border rows. The experimental sites were plowed three times with draught animals called oxen before planting, and 100 kg ha-1 seed rate and 100 kg ha-1 of NPS fertilizer rate were used according to crop recommendations. Other agronomic and protection practices were applied uniformly to the entire experimental area (Table 2).
![]()
    Varieties
    Seed size and    Color
    Year of Release
    Source


    Mex-142
    Small white
    2016
    MARC/EIAR


    RAZ-42
    Small white
    2019
    MARC/EIAR


    Awash-1
    Small white
    2012
    MARC/EIAR


    Awash melka
    Small white
    2004
    MARC/EIAR


    Awash mitin
    Small white
    2017
    MARC/EIAR


    Wabero
    Small white
    2018
    SARC/OARI


    Local
    Small white
    -
    Farmer


    Source: Crop    variety register.
Table 2: Description of small white common bean varieties used in the
experiment.
Data Collection and Statistical Analysis
Experimental data were collected on individual plant basis for plant height, number of pods per plant, number of seeds per pod while on plot basis were collected on days to flowering, days to maturity, grain yield and disease data. The analysis of variance (ANOVA) for each location and combined analysis of variance over locations were performed using the R software and the mean separation was done using Least Significant Difference (LSD) at the 5% probability level. The linear mixed model was used in the analysis of variance to combine over locations.
GGE Bi-plot and AMMI Stability Analysis
The GGE bi-plot was used to evaluate the test genotypes and environments. An environment is considered ideal for genotype testing when it discriminates the genotypes and represents the environments [12]. The presence of correlation between two environments means that similar information about the genotype performance is derived from them and therefore could be an option to reduce the number of test environments. In addition, GGE bi-plot is an effective visual tool for identifying the mega-environment issues and showing the specific adaptation of the genotypes and which cultivar won in which environments [13]. A mega-environment is defined as a group of locations that steadily share the same best cultivar [14].
Results and Discussion
Combined Analysis of Variance
The analysis of variance for the measured traits of the tested varieties showed there were significant differences at (p<0.05 and p<0,001). The analysis of variance for the measured traits of the tested varieties showed there were significant differences for both main effect of variety and locations in all parameters. The interaction of variety and location showed significant difference (p<0.001) days to flowering, days to maturity, number of pod, per plant, seed per plant and grain yield but not for plant height (Table 3). Hence, the parameters were varying among varieties over locations. The observed differences among the varieties could be due to variation in the genetic makeup of these varieties and influence of environmental factors. The highly significance difference for grain yield among the locations, varieties and interaction indicates that the environments have different impact on the yield potential of the varieties though the varieties have different performance in the tested environments. The mean yield potential of the varieties varying across environments and among varieties indicating the varieties were expressing their potentials even though they were affected by environments and genetic variations. The same results were reported by Perreira et al., [15] and Perreira et al. [16] which indicated that common bean varieties can have different response and interact highly to environmental variation.
![]()
    Source of variation
    Mean    squares


    Df
    DF (days)
    DM (days)
    PH (cm)
    NPP
    NSP
    GY (kgha-1)


    Replication
    2
    4.15ns
    10.70ns
    40.30ns
    1.99ns
    0.71ns
    383540ns


    Varieties
    6
    96.16***
    904.95***
    519.51***
    26.75*
    12.83**
    7739218***


    Location
    2
    207.65***
    605.58***
    2930.73***
    305.14***
    3.79*
    9808114***


    Var : Loc
    12
    41.49**
    162.69***
    214.85ns
    29.55**
    1.89**
    2283137***


    Var : Year
    6
    272.82***
    624.60***
    1272.01***
    281.08***
    7.23***
    1357279***


    Residual
    82
    22.56
    34.4
    101.59
    29.26
    1.22
    279993


    Note:    SOV=Source of Variations, Df=degrees of freedom, DF=days to flowering,    ,DM=days to maturity, PH=Plant height,    NPP=number of pod per plant, NSP=number of seed per pod *** significant    (0.001), *=significant at (0.05) & ns= non-significant.
Table 3: ANOVA for yield and yield related traits for seven (7) small white
common bean varieties.
Performances of Small White Common Bean Grain Yield Across Locations
The analysis of variance revealed a highly significant difference (p<0.001) among the varieties in all locations for grain yield (Table 4). According to the result, the highest mean grain yield was exhibited by the variety Awash mitin (2330.51kgha-1) followed by Wabero (1878.11kgha-1), whereas, the lowest grain yield performance was recorded for variety Awash-1 (1261.36 kgha-1).
![]()
      Varieties
    Buno Bedele
    Ilu Aba Bora

      Overall Means

      YA (%)


    Bedele
    Dabo Hana
    Bure


      Mex-142

    2031.66ab
    1765.51bcd
    1053.06bc
    1616.74bc
    -2.81


      RAZ-42

    1840.51bc
    1645.91cd
    1391.39ab
    1626.58bc
    -2.22


      Awash-1

    1413.54cd
    1289.99d
    663.89c
    1261.36c
    -24.17


      Awash melka

    1211.88d
    1226.13d
    985.28bc
    1307.76c
    -21.38


      Awash mitin

    2559.10a
    2886.61a
    1712.50a
    2330.51a
    40.10


      Wabero

    2010.75ab
    1883.85bc
    1393.33ab
    1878.11b
    12.90


      Local

    1619.13bcd
    2222.36b
    1148.89abc
    1663.46bc
    0


    Mean
    1812.37
    1845.77
    1192.62
    1668.50


    LSD (0.05)
    567.65
    548.08
    623.47
    415.19


    CV (%)
    26.66
    27.27
    29.50
    31.65


    P-value
    ***
    **
    *
    ***


    Note: LSD=least significant    difference, CV= coefficient of variation, NS=non-significant, *, ** and    ***, significance at 0.05, 0.01 and 0.001 probability levels respectively and    YA=yield advantage.
Table 4: Combined mean grain yield (kg ha-1) of seven (7) small Common bean
varieties tested at Bedele, Dabo Hana and Bure districts for two years (2023-
2024).
The high yielder variety at most locations was found with Awash mitin variety which indicates the presence of genetic potential for resistance of varies stress conditions for creating this stability of yield potential across locations. Generally, the varieties respond differently to diverse environments leading to the essence of identification of a potential variety for specific location. Similarly, the existence of wide genetic variation in grain yield and yield components of common bean has been reported by various authors [17,18].
Performances of Agronomic Phenology, Growth and Yield Related Traits
The combined analysis of variance over the two seasons revealed a highly significant (P < 0.01) difference in flowering days, maturity days, height of the plant, number of pod per plant and number of seed per pod between the studied varieties (Table 4). This finding suggests that genotypic variability exists among the small white common bean varieties studied and the traits under consideration.
Days to Flowering (DF)
Days to flowering and maturity are among the most vital characteristics that need to be considered in selecting varieties when and where the lack of rainfall is limiting factor for further enhancement of yield and yield related traits. The earliness trait (days to flowering and days to physiological maturity) enables crops to flower and mature early, escaping from moisture stress that results in reduced yield. According to this study, the mean of days to flowering over location was ranged from 35.00 to 45.33 from Awash-1 and Local check respectively.
Days to Maturity (DM)
There was significant variation (P < 0.01) in yield components among the small white common bean varieties in the combined analysis over location (Table 4) at all sites. The interaction of variety with location also significantly affected days to physiological maturity and grain yield in the combined analysis. Among the tested varieties the Wabero and Awash mitin were early matured with respective values of 71.20 and 72.40 days. On the other hand, Local check and RAZ-42 had longest time of maturity with respective values of 89.20 and 82.27 days (Table 4). This indicated that, the advantage of those varieties for escaping moisture stress condition of study area. Tigist et al. [7] studied on 144 genotypes of common bean at three locations of Oromia region and indicated that days to maturity showed a significant difference between varieties, locations and GXE interactions.
Number of Pods per Plant (NPP)
The interaction of small white common bean varieties with different locations revealed a highly significant (p<0.01) difference on number of pods per plant (Table 4). The higher number of pods per plant was recorded from Awash mitin (24.19) followed by Wabero (18.03) as compared to other testing varieties, whereas the lowest was obtained from Awash-1 variety (13.17) However, it is difficult to conclude increment number of pod per plant can be increase yield per hectare; because total yield also influenced by the yield harvested from individual plant and number of plants per hectare. Etana and Nebiyu [2] reported that number of pods per plant showed significant difference between four studied common bean varieties, of which, two from farmers cultivars and two from improved varieties
Number of Seeds per Pod (NSP)
The varieties and locations alone revealed a highly significant difference on number of seeds per pod (Table 4). Maximum number of seeds per pod was recorded from Awash mitin (7.18) variety followed by Wabero (6.68) variety. Whereas, the lowest number of seeds per pod (4.18) was obtained with local check. This variation could be due to genetic inherent of those improved small white common bean varieties produced more number of seeds per pod. Etana and Nebiyu [2] also reported that number seeds per pod showed a highly significant difference between the varieties in common bean.
Plant Height (PH)
There was significant difference among the verities for plant height. Maximum plant height was noted in variety RAZ-42 (75.40cm) followed by Mex-142 (74.65cm), whereas; the lowest plant height was recorded in local variety (64.61 cm).
Reaction to Major Diseases
The major common bean diseases according to their importance in the growing areas are rust, anthracnose and bacterial blight rust are the most important ones among the various diseases that affect the crop. In 1-9 rating scale, Awash mitin, Wabero and RAZ-42 scored 3 (moderately resistant) for all the above mentioned diseases. The varieties are characterized by moderately resistance types of reaction to these major diseases at all the sites (Table 5).
![]()
      Varieties


      DF (days)


      DM (days)


      PH (cm)


      NPP


      NSP


      Dis.(AB)


      Mex-142


      39.80bcd


      76.87bc


      74.65a


      14.70bc


      5.98bc


      40ms


      RAZ-42


      43.40ab


      82.27ab


      75.40a


      16.63bc


      6.48abc


      20mr


      Awash-1


      35.00d


      76.87bc


      62.08b


      13.17c


      5.79c


      40ms


      Awash melka


      42.60abc


      75.67bc


      65.76ab


      15.02bc


      5.80c


      40ms


      Awash mitin


      41.60abc


      72.40c


      65.44ab


      24.19a


      7.18a


      20mr


      Wabero


      37.47cd


      71.20c


      62.17b


      18.03b


      6.68ab


      20mr


      Local


      45.33a


      89.20a


      67.15ab


      14.83bc


      4.18d


      40ms


      Mean


      40.74


      77.78


      67.52


      16.65


      6.01


      LSD (0.05)


      5.44


      7.17


      11.41


      4.43


      0.85


      CV (%)


      18.43


      12.72


      23.32


      26.72


      19.50


      P-value


      **


      ***


      **


      **


      ***


      Note: DF= days to    flowering, DM= days to maturity, PH= plant height, NPP= Number of pod per    plant, NSP= Number of seed per pod, AB=Aschochyta Blight, LSD=least    significant difference, CV= coefficient of variation, NS=non-significant, ** &    ***, significance at 0.01 and 0.001 respectively.
Table 5: Combined ANOVA of yield related traits for seven small Common bean
Varieties.
Additive Main Effects and Multiple Interaction (AMMI) model
The AMMI analysis of variance of seven (7) small white common bean tested over six environments revealed that 14.92% of the total sum of squares (SS) was contributed to environments (E), 25.76% to the genotypes (G) and 23.08% to GEI effects (Table 6). A large SS for environments indicated that the genotypes were diverse with large differences among the means. The magnitude of G x E SS was close to that for the SS for G, thus indicating that the differences in the response of the genotypes across environments were noteworthy.
![]()
    SOV
    Df
    SS
    MS
    Variance (%)
    Cumulative (%)


    REP (ENV)
    12
    1809405.1
    150783.76ns


    ENV
    5
    26899201.2
    5379840.24**
    14.92


    GEN
    6
    46435309.5
    7739218.25**
    25.76


    GEN: ENV
    30
    41599860.1
    1386662.00**
    23.08


    PCA-1
    10
    30699606.7
    3069960.67**
    73.80
    73.80


    PCA-2
    8
    6245486.0
    780685.75*
    15.01
    88.81


    Residuals
    72
    21917118.0
    304404.42


    Total
    155
    180260754.2
    1162972.61


    Note: *** Significant difference at (P=0.001), SOV=source of    variation, Df=degree of freedom, SS=sum of square, MS=mean sum of square,    PCA= principal component of axis.
Table 6: AMMI analysis for grain yield of seven (7) small white common bean
varieties.
The first principal component axis (PCA-1) accounted for 73.80 % of the interaction SS in 19.35% of the interaction degrees of freedom and PCA-2 explained further 15.01% of the interaction SS (Table 5). The mean square (MS) for both IPCA-1 and IPCA-2 were significant at P<0.01 and p<0.05 levels respectively and cumulatively paid to 88.81% of the total interaction.
GGE Bi-plot Analysis
GGE bi-plot is important to visualize the genotype by environment interaction. The GGE bi plot graphic analyses of the seven small white common bean varieties tested across six environments are presented in the figures below.
Ranking Genotypes
Stability can be identified using concentric circles and also ideal genotypes are at the center of the concentric circle. The ideal genotype is the one that with the highest mean performance and absolutely stable [12]. The genotypes that are closer to the ideal genotypes are the best performing genotypes. Hence, the GGE bi plots shows that Awash mitin is an ideal variety, with other varieties like Wabero and Local are desirable varieties as they are closer to the ideal variety on the bi plot. The varieties Awash-1 and Awash-melka are the most undesirable varieties as they are too far to the ideal variety on the bi plot.
Ranking of Environment
The most representative of the environments (ability to represent the mega environment) and the most powerful to discriminate varieties reported that the ideal environment is the one located at the center of the concentric circles, and it is possible to identify desirable environments based on their closeness to the ideal environment. Therefore, Among the test locations, location E1 which fell into the center of concentric circles was an ideal test location in terms of being the most representative of the overall environments and the most powerful to discriminate the performance of the tested genotypes.
Next to the first concentric circle location, environments E3, E4 and E2 are close to the best environment while, environments E5 and E6 are noticed as the weakest locations to classify varieties (Figure 2).
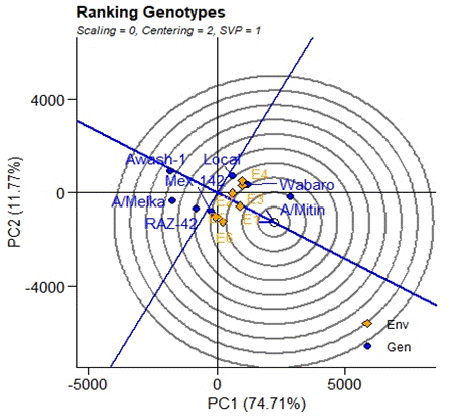
Figure 1: Ranking of the seven varieties tested across environments.
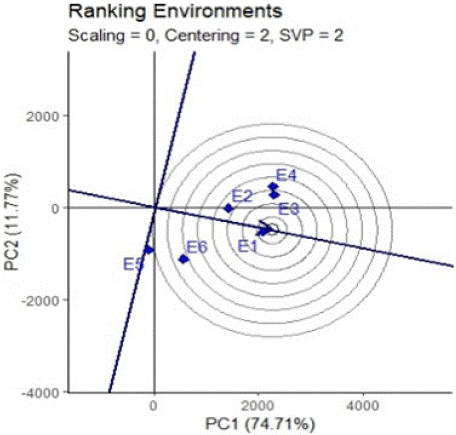
Figure 2: Ranking of six environments.
Which-Won-Where Pattern
The polygon view of GGE bi-plot indicates the best genotypes in each environment and group of environments [14]. The polygon is formed by joining the genotypes that are farthest away from the bi-plot origin, such that all the other genotypes are contained in the polygon. In this case, the polygon connects all the farthest genotypes and perpendicular lines divide the polygon into sectors. Sectors help to visualize the mega-environments. This means that winning genotypes for each sector are placed at the vertex. Polygon view of the small white common bean varieties tested at six environments locations presented in (Figure 3). Hence, Awash-1, Awash melka, RAZ-42, Mex-142, Awash mitin and local varieties were the vertex small white common varieties. From this figure, Wabero, Awashmitin and Local varieties well performed at E4, E3, E2 and E1 in the first mega environment. In the second mega environment Mex-142 variety was good performed at E5 and E6. From the figure, Awash-1, Awash melka and RAZ-42 had no environment on the vertex. This indicates that varieties in the vertex without environment performed poorly in all the locations.
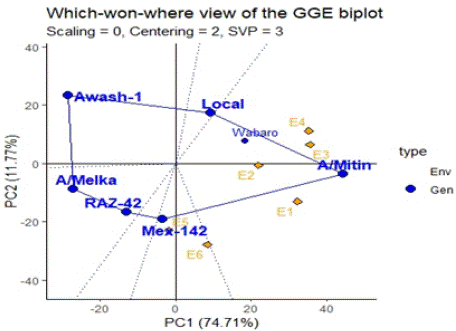
    Figure 3: Polygon views of the GGE-bi-plot for which-won where and
mega- environment.
Conclusion and Recommendation
Common bean is one of Africa's most vital pulses. The adaptation of common bean varieties to drought-stress situations is very crucial for drought vulnerable areas particularly lowland parts of Ethiopia. The crop provides vital nutrients as a food including vitamins, proteins, minerals and the stems are also used as fodder for livestock, especially in the dry spell following the main cropping season. As a legume, common bean plants also contribute to soil fertility enhancement through atmospheric nitrogen fixation.
The present study shown the presence of genetic variability among varieties with respect to different traits. The presence of significant difference among common bean varieties for the studied traits ensured the presence of large genetic variation to be improved through selection. Plant breeding is primarily depending on presence of substantial genetic variation to address the maximum genetic yield potential of the crops and exploitation of these variations through effective selection for further improvement.
Analysis of variance showed highly significant varietal differences days to flowering, plant height and number of pod per plant at 1% probability level and very highly significant difference observed for days to maturity, number of seed per pod and grain yield 0.1% probability level. The combined means result indicated that the Awash mitin (2330.51kgha-1) and Wabero (1878.11kgha-1) small white common bean varieties had the highest yield respectively. Thus, Awash mitin and Wabero were identified as the best varieties in terms of yield, stability, tolerant to diseases and better agronomic performance. Hence, as compared to the others, those two small white common bean varieties were recommended as promising varieties to the farmers of study areas with similar agro-ecologies based on their optimal yield performance for further adoption.
Acknowledgments
The authors warm gratitude and acknowledge goes to Oromia Agricultural Research Institute and Bedele Agricultural Research Center for providing research budget and facilitate the process. We would like also to express sincere thanks to Melkasa and Sinana Agricultural Research Centers for providing experimental materials and also crop research processes members for contributing their great effort in the fruitful achievement of the trial.
References
- Pandey M and Kumar N. Diversity of traditional grain legumes of himalayan region of uttarakhand: A review. Agricultural Reviews. 2024; 45: 96-102.
- Etana D and Nebiyu A. Response of common bean (Phaseolus vulgaris L.) to lime and TSP fertilizer under acid soil. Heliyon. 2023; 9.
- Huang Y, Liu X, Cao D, Chen G, Li S, Wang G, et al. Cross-species Amplification of Common Bean (Pha seolus vulgaris) EST-SSRs within Hyacinth Bean, Pea and Soybean. Legume Research. 2021; 44: 287-291.
- Legesse DG, Kumssa T, Assefa M, Taha J, Gobena T, et al. Production and Marketing of White Pea Beans in the Rift Valley, Ethiopia. A Sub-Sector Analysis. National Bean Research Program of the Ethiopian Institute of Agricultural Research. 2006.
- Fikru M. Haricot Ban (Phaseolus vulgaris L.) Variety Development in the lowland areas of Wollo. Proceedings of the 2nd Annual Regional Conference on Completed Crops Research Activities. Bahir Dar, Ethiopia. 2007; 86-93.
- Buruchara R, Rowland C, Sperling L, Claire M, Jean-Claude R, Mutonhi R, et al. Development and delivery of bean varieties in Africa: The Pan-Africa Bean Research Alliance (PABRA) model. African Crop Science Journal. 2011; 19: 227-245.
- Tigist S, Julia S, Assefa A and Gemechu K. Agromorphological and physiological performance of Ethiopian common bean (Phaseolus vulgaris L.) genotypes under different agroecological conditions. Plants. 2023; 12: 23-42.
- CSA. Report on Area and Production of Major Crops. In The Federal Democratic Republic of Ethiopia Central Statistical Agency (CSA). 2021; 1.
- Central Statistical Agency (CSA). Agricultural Sample Survey Series: Report on Area and Production for Major Crops (Private Holdings, Main Season). Addis Ababa, Ethiopia. 2022.
- Ali K, Ahmed S, Beniwal S, Kenneni G, Malhotra RS. Food and forage legumes in Ethiopia. Progress and prospects, Proceedings of the workshop on food and forage legumes 22-26 September 2003, Addis Ababa, Ethiopia. 2006.
- Ferris S and Kaganzi E. Evaluating marketing opportunities for haricot beans in Ethiopia. 2008.
- Yan W, Kang MS. GGE Biplot Analysis: A Graphical Tool for Breeders, Geneticists, and Agronomists; CRC Press LLC: Boca Raton, FL, USA. 2003; 271.
- Yan W, Hunt LA, Sheng Q, Szlavnics Z. Cultivar evaluation and megaenvironment investigation based on the GGE biplot. Crop Sci. 2000; 40: 597–605.
- Yan W, Rajcan I. Biplot analysis of test sites and trait relations of soybean in Ontario. Crop Sci. 2002; 42: 11–20.
- Perreira HS, Melo LS, Faria LC, Diaz JLC, Peloso DMJ, Costa JGC and Wendland A. Stablity and adaptablity of Carioca Common Bean Genotypes in States of Central South Region of Brazil. Crop Breeding and Applied Biotechnology. 2009; 9: 181-188.
- Perreira HS, Melo LC, Faria LC, Diaz JL, Peloso MJ and Wendland A. Environmental strastificatioin in Parana and Santa Catarina to Evaluate Common Bean Genotypes. Crop Breeding and Applied Biotechnolgy. 2010; 10: 132-139.
- Loha Gobeze and Silas Merkineh and Gidago Gifole. Effect of common bean (Phaseolus vulgaris L.) varieties and variable rates of potassium fertilizer on yield and yield-related traits at areka, Southern Ethiopia. Applied and Environmental Soil Science. 2023; 1-8.
- Food and Agriculture Organization of the United Nations (FAO). Faostat. 2023.